


How project management dashboards drive measurable business value
Content
Have you ever noticed how project portfolio reviews still raise more questions than answers, even when every project reports its status on time?
As organizations run more initiatives in parallel, leaders struggle to understand what is really happening across the project portfolio. Data exists, but it remains fragmented. And by the time delivery risks and budget issues become visible, options are already limited.
According to PMI’s Pulse of the Profession report, organizations with mature project portfolio management practices complete significantly more projects and experience fewer failed initiatives. Visibility at portfolio level plays a key role in that difference.
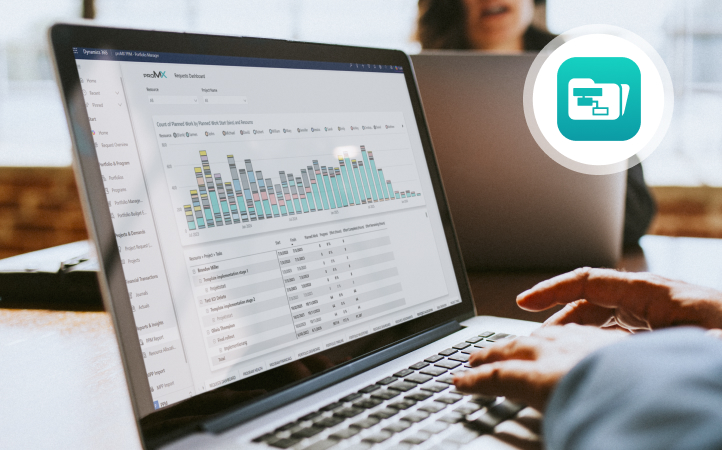
In this article, we explore why dashboards matter, which metrics drive value, and how proMX 365 Project Portfolio Management supports better portfolio decisions in practice.
Types of project management dashboards
Imagine you are in a quarterly steering meeting. Ten projects are marked yellow, two show cost pressure, and three request additional capacity.
The issue is not visibility but prioritization. What do you address first?
At portfolio level, leaders need context more than they need operational detail. Cost variance, capacity gaps, and strategic contribution do not carry the same weight, and they cannot be assessed through a single lens.
Different decisions require different perspectives. Financial exposure demands one view; delivery feasibility requires another and so on.
That is why effective portfolio governance relies on multiple dashboard types rather than one consolidated report.
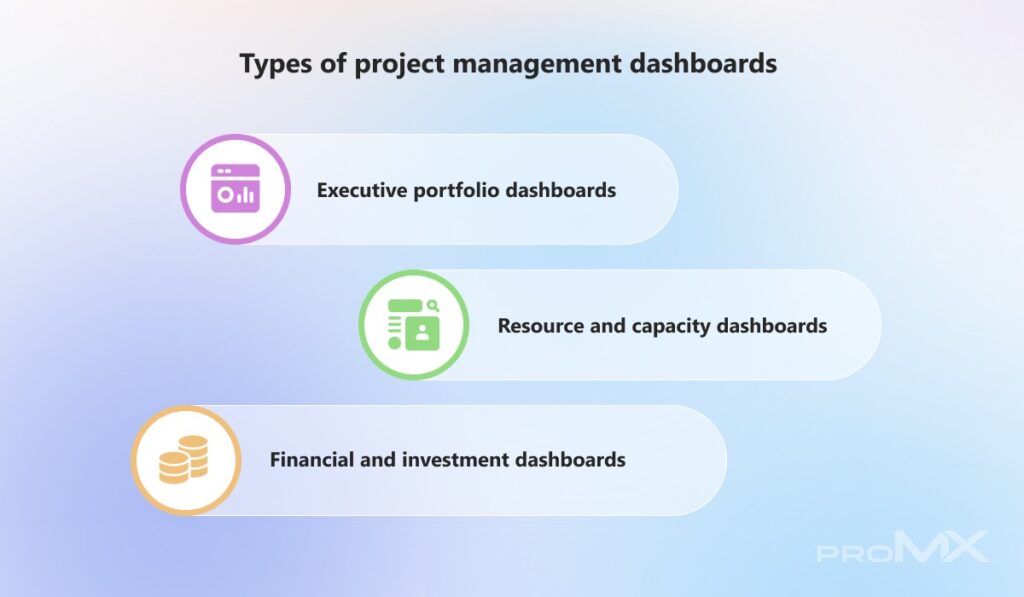
- Executive portfolio dashboards
Executive dashboards help you assess whether the portfolio still supports current priorities. They surface high-level indicators that support direction-setting and intervention decisions during steering or investment discussions.
Details stay intentionally limited. When you need task-level insights, you can pull them separately. These dashboards should be used for decision-making and not monitoring.
- Resource and capacity dashboards
Resource and capacity dashboards answer a more practical question: Can we actually deliver what we have approved?
They show how demand builds over time and how it compares with available capacity. This shifts discussions away from effort and toward feasibility.
- Financial and investment dashboards
Financial dashboards focus on how portfolio spending behaves over time. They help you see whether funding assumptions still hold as initiatives progress.
Instead of reacting to individual overruns, you can assess how financial pressure develops across the portfolio and adjust funding decisions before the exposure increases.
Understanding the different dashboard types is only the starting point. Once each perspective is clearly defined, the next question becomes practical: what exactly should these dashboards display to support confident decisions at portfolio level?
Key metrics that matter at portfolio level
Portfolio reviews often focus on individual project updates. Progress looks acceptable, risks are explained, and budgets seem under control. What is harder to see is whether the portfolio as a whole is still realistic.
Several projects can stay within tolerance while pressure builds quietly across shared roles, timelines, or forecasts. These patterns only become clear when you step back and look at the bigger picture.
At portfolio level, metrics should not just report status. They should show whether your plans still make sense and where strain is starting to build.
The indicators below help you spot those signals early, while there is still room to adjust.
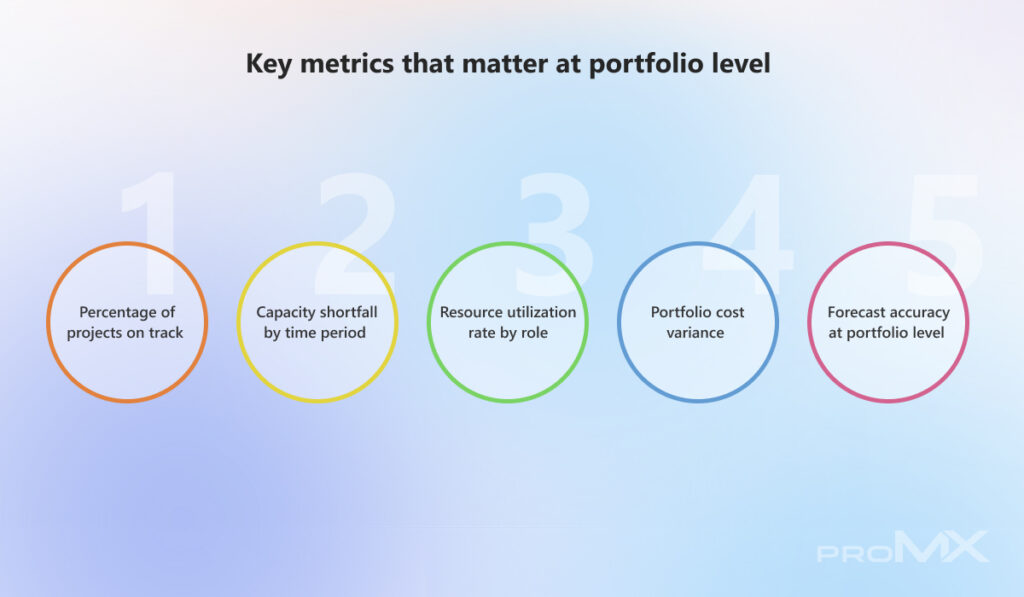
- Portfolio delivery health (%)
This metric shows whether delivery plans are still held at the portfolio level. A stable trend usually means planning assumptions remain valid. When it drops, the cause is often beyond individual projects.
If several initiatives move off track in the same period, the issue is typically linked to timing or shared dependencies, which calls for a portfolio-level response rather than project-by-project escalation.
- Capacity gaps over time
The capacity shortfall shifts the focus from today to what comes next. It shows when planned work will exceed available capacity, even if teams still appear free today.
For example, you may approve new work based on current availability, only to see the same teams become overcommitted later. This view gives you time to adjust sequencing while options remain open. Once shortfall reaches execution, flexibility narrows quickly.
- Role-based capacity risk
Utilization by role highlights where delivery depends on specific skills rather than overall staffing levels. It becomes especially important when replanning fails to reduce sustained overload in key roles.
Teams may absorb pressure in the short term, but that effort hides risk. Role-based utilization exposes these constraints early, before delays surface elsewhere in the portfolio.
- Portfolio spend drift
Portfolio cost variance shows how financial pressure develops across initiatives. Individual projects may stay within tolerance while the portfolio gradually drifts off plan.
This usually happens when small overruns repeat or forecasts shift in the same direction over time. When you see this pattern, the right response is to revisit funding assumptions or portfolio scope, not to escalate a single project.
- Portfolio forecast reliability
Forecast accuracy reflects confidence in the planning process. When forecasts are missed repeatedly, optimistic assumptions are often the root cause. Low accuracy makes it harder to set priorities and slows approvals.
Teams that track this metric over time often find that stronger estimation discipline allows earlier adjustments and reduces the need for reactive control.
Understanding the different dashboard types is only the starting point. Once each perspective is clearly defined, the next question becomes practical: what exactly should these dashboards display to support confident decisions at portfolio level?
How to create a project management dashboard
Portfolio reviews often focus on individual project updates. Progress looks acceptable, risks are explained, and budgets seem under control. What is harder to see is whether the portfolio as a whole is still realistic.
Several projects can stay within tolerance while pressure builds quietly across shared roles, timelines, or forecasts. These patterns only become clear when you step back and look at the bigger picture.
At portfolio level, metrics should not just report status. They should show whether your plans still make sense and where strain is starting to build.
The indicators below help you spot those signals early, while there is still room to adjust.
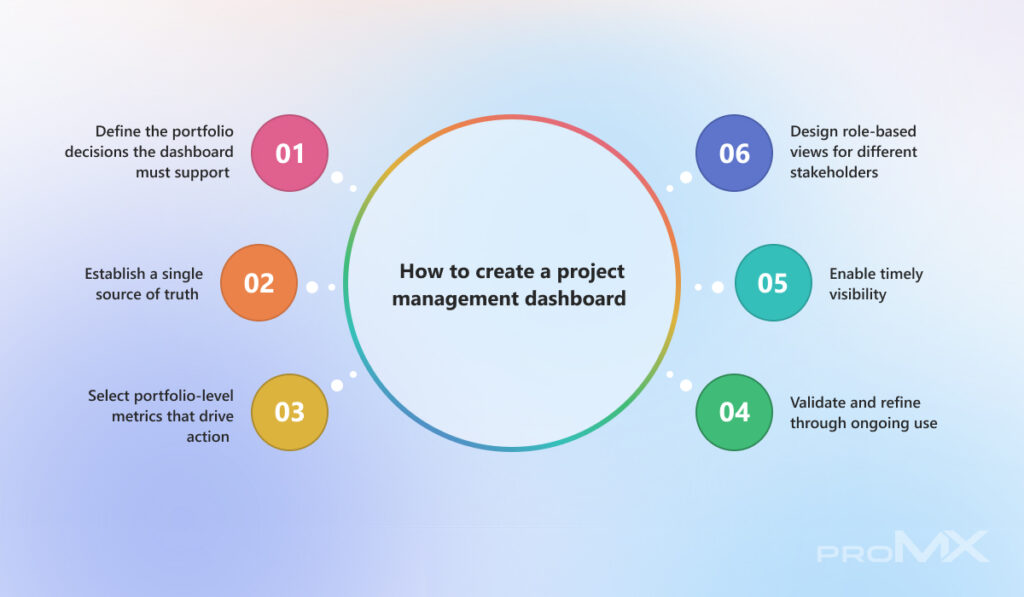
- Define the portfolio decisions the dashboard must support
Start with decisions, not data. Ask yourself what should become easier once the dashboard exists.
If that answer isn’t clear, the dashboard will become a place that shows everything and influences nothing. At portfolio level, dashboards need to support moments, such as approving or holding work, reassessing confidence in the plan, or checking whether capacity can absorb what’s coming next.
You should design around these decision points. A simple rule helps here: if removing a metric doesn’t change how you decide, it doesn’t belong on the dashboard.
- Establish a single source of truth
Once decision intent is clear, inconsistency becomes the main risk. Dashboards lose credibility when the same numbers appear differently across sources.
This often happens when updates run on different schedules. If project progress, capacity data, and forecasts refresh at different times, review meetings turn into debates about data instead of decisions.
A shared data foundation keeps discussions focused on action. When trust in the numbers fades, the dashboard quickly loses its value.
- Select portfolio-level metrics that drive action
Portfolio dashboards should draw your attention to emerging pressure before it affects delivery. At this level, metrics work best when they signal confidence or feasibility rather than activity.
A drop in projects on track often points to portfolio strain, not isolated execution issues. Role-based utilization shows a similar pattern when plans depend too heavily on limited expertise.
Choose metrics that help you decide when to intervene and where to look next. Keep execution details inside projects, not at the portfolio level.
- Design role-based views for different stakeholders
People use portfolio information with different intents. A single view cannot meet every need. Executives focus on exposure and direction, whereas PMOs look for stability, and portfolio managers assess feasibility.
Role-aware views reduce misinterpretation and shorten discussions, even when everyone works from the same data.
- Enable timely visibility
Dashboards support decisions only when they reflect current conditions. Leaders rely on them to decide whether to stay on the course or step in. When updates lag behind reality, relevance fades quickly.
Set refresh cycles based on how often decisions happen, not on reporting convenience. Data that arrives on time often supports better decisions than perfectly precise data that arrives too late.
- Validate and refine through ongoing use
No dashboard gets everything right at first. Early versions often reveal gaps rather than final answers.
Watch how portfolio leadership uses the dashboard during reviews. Notice which views trigger discussion and which metrics rarely influence decisions.
As priorities and governance evolve, adjust the dashboard so it continues to support real decisions. A static dashboard won’t keep pace with a changing portfolio.
Refinement does not end with internal alignment. Once dashboards consistently support governance conversations, their real value becomes visible in how they influence speed, control, and risk across the portfolio.
How project management dashboards deliver measurable business value in practice
Portfolio decisions often look simple until the consequences become unclear. A new initiative is proposed, it aligns with strategy, and support builds quickly. Then the real question comes up: what changes across the rest of the portfolio?
Adjusting one timeline can affect shared roles and shifting budget can influence other commitments. Without a clear view of those connections, decisions slow down.
By bringing portfolio, resource, financial, and risk insight into decision-focused dashboards, proMX 365 Project Portfolio Management turns visibility into practical, day-to-day portfolio control.

Faster portfolio-level decision-making
In many organizations, portfolio decisions stall because portfolio leadership lacks a shared view. Information lives across disconnected tools, which forces teams to reconcile data before they can even discuss options.
proMX 365 PPM’s advanced version control and comparison combined with scenario planning dashboards address this by bringing alternatives into one place.
Using these dashboards, you can create multiple portfolio versions and compare them side by side. Each version reflects how a change affects the portfolio as a whole.
Metrics such as the percentage of projects on track or forecast cost variance update as scenarios change.
This approach is particularly useful for construction companies, where long planning horizons and operational dependencies make late decisions costly. Instead of debating assumptions, decision-makers review concrete scenarios and move forward with clarity.companies, where long planning horizons and operational dependencies make late decisions costly. Instead of debating assumptions, decision-makers review concrete scenarios and move forward with clarity.
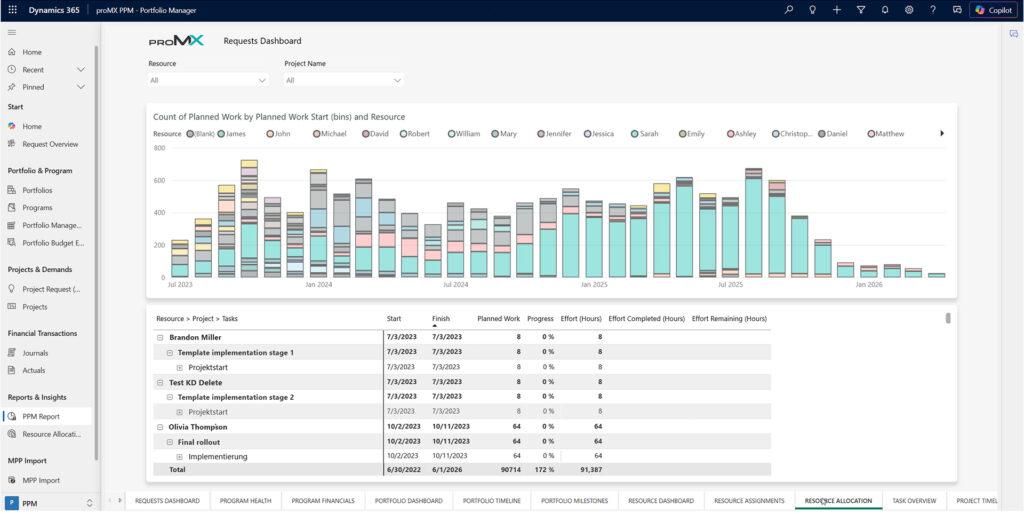
Better resource and capacity control
Resource and capacity management improves when availability appears in the same context as planned work. Portfolio and data overview dashboards make it possible to see future demand alongside existing commitments, instead of reviewing resource plans in isolation.
These views help you:
- Identify where specific roles approach capacity limits in upcoming periods
- Focus attention on time windows where demand begins to exceed supply
This visibility is especially important in the Energy industry, where large infrastructure and renewable initiatives depend on a limited pool of specialized expertise.
Reviewing future capacity in the portfolio view allows teams to adjust sequencing early, before shortages affect delivery timelines or regulatory obligations.
In Professional Services, the same views help teams balance delivery commitments with billable utilization. Overbooking becomes visible in the portfolio context, which supports earlier intervention and reduces reliance on manual reports or late-stage corrections.
Lower delivery risk across projects
Many delivery risks come not from individual projects, but from how projects connect over time. Relationship and dependency insights in the portfolio Gantt view make these connections visible.
You can see how a change in one project affects downstream schedules and future resource demand, rather than discovering the impact after delivery slips.
This matters greatly for Construction suppliers, as the delays are linked to external constraints can cascade quickly across connected projects.
Dependency dashboards give teams time to adjust plans before delays spread. When teams pair this visibility with portfolio-level risk tracking, risk management becomes part of regular planning rather than a last-minute response.

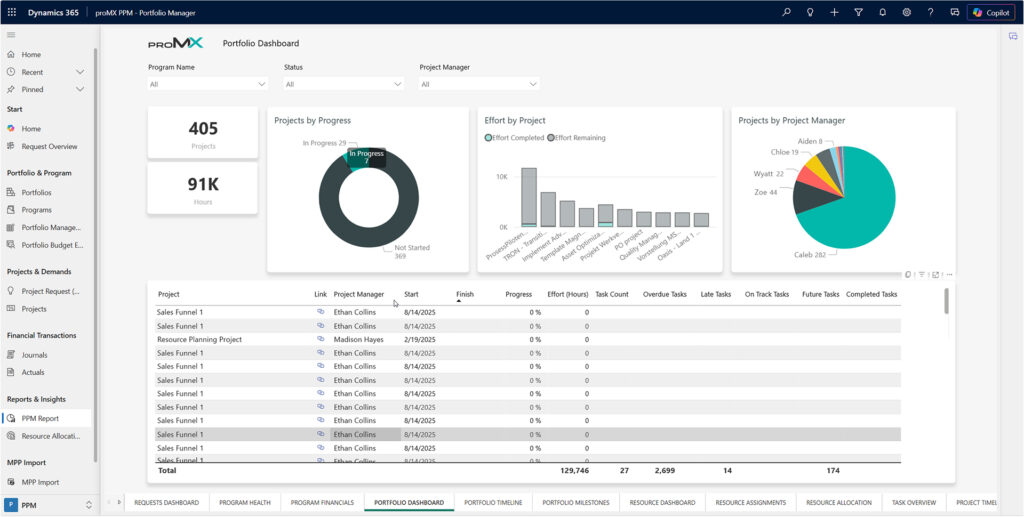
Stronger portfolio financial control
Financial pressure rarely appears as a single, obvious overrun. It builds quietly as small variances repeat across multiple initiatives. While individual projects may remain within tolerance, the combined effect can push the portfolio off plan.
Portfolio budget views show when actual spending starts to drift from the forecast plans. You can compare current spending with original expectations and see changes develop over time, instead of finding surprises at year-end.
This insight is especially valuable for the Logistics and Transportation providers, where funding constraints and shifting priorities require close oversight.
A forward-looking view of financial commitments allows teams to assess new approvals early and adjust investment levels while options remain open.
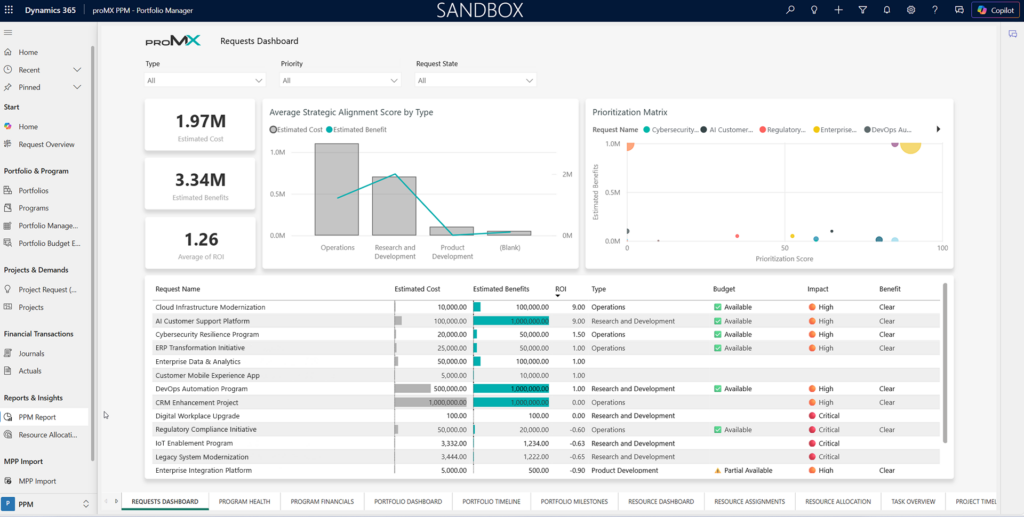
Clearer strategy-to-execution alignment
Portfolio priorities can shift as new initiatives are approved and existing ones continue to run. Over time, some projects may no longer support the goals they were originally funded to achieve.
With portfolio overview dashboards, initiatives remain linked to the strategic context that defines why they exist. You can filter portfolios by investment focus and see where attention concentrates across ongoing work.
This capability is particularly relevant for Energy companies and Manufacturing organizations, where long-term programs compete for limited investment. When priorities change, teams can realign the portfolio early instead of correcting courses later at a higher cost.
Project management dashboards work best when they support how portfolios are actually run. With the right structure in place, you can move from reviewing status to guiding outcomes with confidence.
Conclusion
Project management dashboards work best when they support how portfolios are actually run. With the right structure in place, you can move from reviewing status to guiding outcomes with confidence.
If you’re ready to bring more clarity into portfolio decisions and reduce reliance on manual reporting, proMX 365 Project Portfolio Management provides a practical way to do that.
The proMX team would be glad to show how these dashboards fit into your portfolio planning and governance approach.
RECENT POST
OUR EVENTS

