

How to build date tables in Power BI
Content
If you work in Power BI, you will sooner or later be faced with time intelligence functions, for example when needing to compare running values like a Year to Date (YTD) calculation to see your revenues in relation to a date dimension.
To use these functions, a date table is required, and we will have to build one, because the automatically generated date table provided by Power BI doesn’t show in your data model.
With our own table we have full control of the time intelligence functions.
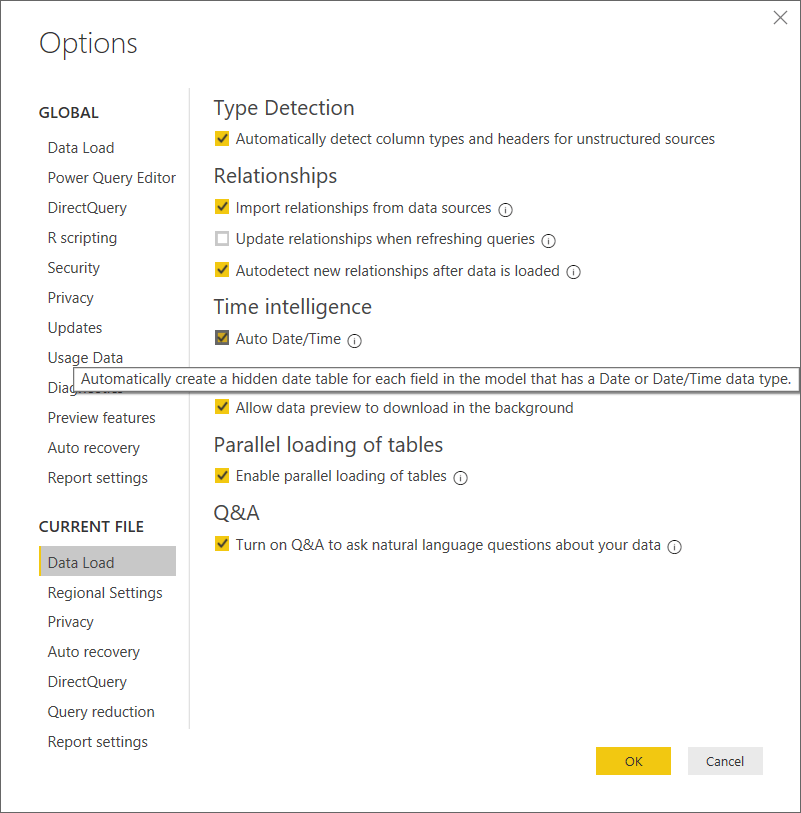
Changing standard settings for time intelligence
In Power BI it is best practice to disable the default use of time intelligence features and create a date-time dimension table by yourself instead. Know your data and how it is related to provide good results instead of using unknown OOTB features you can’t control.
Create your first date table with DAX
When creating your first own date table, some knowledge of Power Query or DAX may be helpful.
- At the very beginning you need to decide which date range you want to cover. Starting from the current date, I prefer to go two years back and two years ahead in time.
Note: When using the dates as a filter criterion to reduce the data load, a good date table can help. The very first function to start with is CALENDAR() where we define our date range.
Date =
CALENDAR(
DATE( YEAR( TODAY() ) -2; 1; 1);
DATE( YEAR( TODAY() ) +2; 12; 31)
)
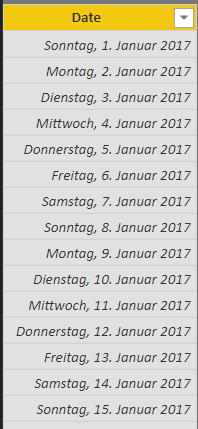
When we use the DAX query, we get our first date table with dates from more than four years. As a best practice it is recommended to always use good formatting. A great example is the DAX formatter.
Now we have our date table and can relax – right? Well, why not extend it instead to get more out of it?
- As a last and final step, change your column to a date-only one. We will need it later in all our Power BI files to link with all the different tables.
Make your date table more user-friendly
In the previous section we created our date table with a lot of dates in it. Using them as a filter on our Power BI reports will confuse the end user, because the table is very long. When we think about what a good date looks like, we think of months, years and maybe grouping by quarters etc.
So, why not extend our small date table a little bit by adding these figures?
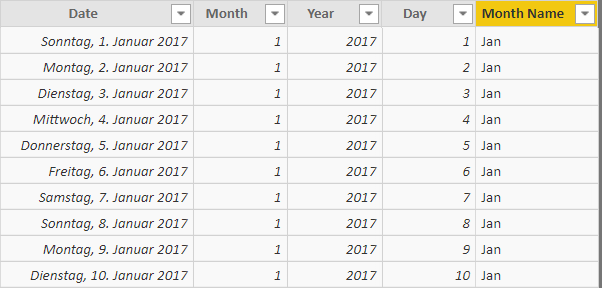
- As a first step we will add new columns to generate the years, months and days based on our date columns. Like in Microsoft Excel, we can use the DAX functions to generate these kinds of columns very easily.

- As we can see at first sight, the months column doesn’t look very nice. A user expects the written name of a month instead of numbers. So, we will add a more user-friendly version as a next column.
- For this we need to parse the number values and translate them by using switch command. In every switch it is a best practice to use the default statement (you never know what will happen).
Month Name =
SWITCH(
‚Date'[Month];
1; „Jan“;
2; „Feb“;
3; „Mar“;
4; „Apr“;
5; „May“;
6; „Jun“;
7; „Jul“;
8; „Aug“;
9; „Sep“;
10; „Oct“;
11; „Nov“;
12; „Dec“;
„oops“
)
When we take a look at our table it looks much better now.
Add combined columns
Ready to fine tune? We need to combine the values of month and year to generate proper yearly overviews. As a final step we also need to sort our columns. By default, the order will be based on the names starting with “a”. For months, this is not helpful at all.
Month Year = ‚Date'[Month Name] & “ “ & ‚Date'[Year]
“&” combines the values, just like in Excel.

- Now we need to set an order for our columns that it is displayed correctly in our reports. For this we generate our desired order by columns using the same technique, and combine the numbers we can filter by.
Month Year No = ‚Date'[Year] & ‚Date'[Month]
- With all our columns set we can define the order by criteria based on the number columns. The “Month Name” will be sorted by “Month” and the new “Month Year” column will be sorted by “Month Year No”.

- We can also add a small calculation for the quarter by dividing the month number by 4.
Quarter = QUOTIENT(‚Date'[Month];4)+1
- With the same logic as we did before, we’ll add a quarter name column to not only display the number value.
Quarter Name = „Qtr “ & QUOTIENT(‚Date'[Month];4)+1
In the table we can’t control the correct order. For this we need a simple chart.
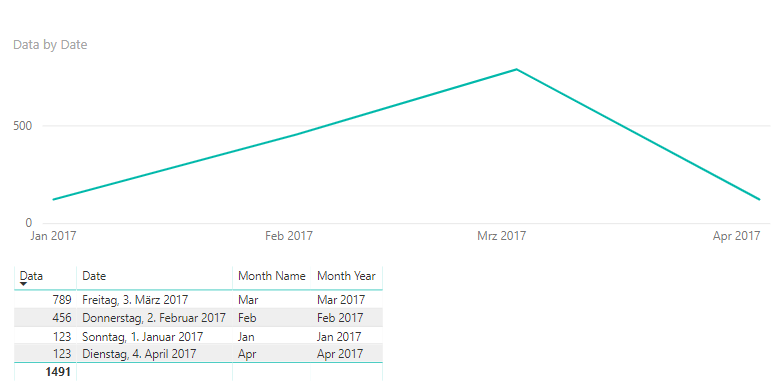
- By verifying the data in a chart, we can see that our ordering is correct. April is the last month in our series of data.
Add a date hierarchy
As a last and final step, we want to define the date hierarchy for our data model. It will enable the drill down function based on our date-time.
- Back in our data view, we’ll select the hierarchy-related columns and add them to a new hierarchy. We right click on the column and add a hierarchy.
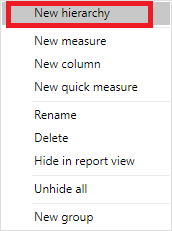
- When the hierarchy is created we can hide all the other columns we don’t need in our report. Our final date table should look like this.

Power Query based date table
In the previous pages we used DAX to create our date table. When you are more familiar with Power Query it can also be used to create our date table.
- For this we switch to the “Edit Queries” section and start by adding a blank custom query to it. In the advanced editor, we can get started by writing our power query.
let
Start = Date.StartOfYear(Date.AddYears(Date.From(DateTimeZone.UtcNow()),-2)),
End = Date.StartOfYear(Date.AddYears(Date.From(DateTimeZone.UtcNow()), 2)),
DayCount = Duration.Days(Duration.From(End – Start)),
Source = List.Dates(Start, DayCount, #duration(1,0,0,0)),
#“Converted to Table“ = Table.FromList(Source, Splitter.SplitByNothing(), null, null, ExtraValues.Error),
#“Changed Type“ = Table.TransformColumnTypes(#“Converted to Table“,{{„Column1“, type date}}),
#“Renamed Columns“ = Table.RenameColumns(#“Changed Type“,{{„Column1“, „Datekey“}})
in
#“Renamed Columns“
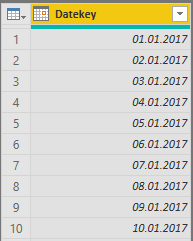
- Our table will look similar and contain a date column. Now by using the default “From Date & Time” functions we will add the different columns as we did when using DAX queries.
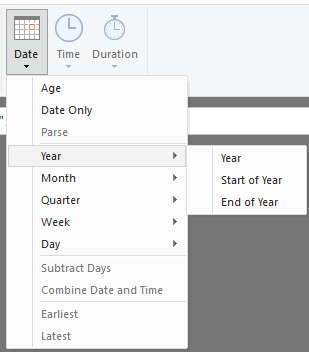
- In the “Add Column” ribbon we can add all the different columns to see quarter, month or day by click.
- For a better sorting we add number columns by using “Add custom column.”
Month Year Name = [Month Name] & “ “ & Text.From([Year])
Final Power Query Date table
We saw both ways of creating a date table by either using DAX or Power Query. It’s up to you which one you prefer.
At the end the table is done, and we can reuse it in any Power BI report we are building and extend it step by step based on our requirements.
We showed a very basic start of a date table and you need to add the values which make sense in your scenarios of implementation.
let
Start = Date.StartOfYear(Date.AddYears(Date.From(DateTimeZone.UtcNow()),-2)),
End = Date.StartOfYear(Date.AddYears(Date.From(DateTimeZone.UtcNow()), 2)),
DayCount = Duration.Days(Duration.From(End – Start)),
Source = List.Dates(Start, DayCount, #duration(1,0,0,0)),
#“Converted to Table“ = Table.FromList(Source, Splitter.SplitByNothing(), null, null, ExtraValues.Error),
#“Changed Type“ = Table.TransformColumnTypes(#“Converted to Table“,{{„Column1“, type date}}),
#“Renamed Columns“ = Table.RenameColumns(#“Changed Type“,{{„Column1“, „Datekey“}}),
#“Inserted Year“ = Table.AddColumn(#“Renamed Columns“, „Year“, each Date.Year([Datekey]), Int64.Type),
#“Inserted Quarter“ = Table.AddColumn(#“Inserted Year“, „Quarter“, each Date.QuarterOfYear([Datekey]), Int64.Type),
#“Inserted Month“ = Table.AddColumn(#“Inserted Quarter“, „Month“, each Date.Month([Datekey]), Int64.Type),
#“Inserted Month Name“ = Table.AddColumn(#“Inserted Month“, „Month Name“, each Date.MonthName([Datekey]), type text),
#“Inserted Day“ = Table.AddColumn(#“Inserted Month Name“, „Day“, each Date.Day([Datekey]), Int64.Type),
#“Inserted Day Name“ = Table.AddColumn(#“Inserted Day“, „Day Name“, each Date.DayOfWeekName([Datekey]), type text),
#“Added Custom“ = Table.AddColumn(#“Inserted Day Name“, „Month Year Name“, each [Month Name] & “ “ & Text.From([Year]))
in
#“Added Custom“
FAQ
What are date tables in Power BI?
A date table in Power BI is a table that contains a range of dates that are used to support time intelligence calculations and analysis in your data model. This table is typically used to group and aggregate data by specific time periods such as year, quarter, month, week, or day.
Why should you use a date table in Power BI?
Date tables are important in Power BI because they allow you to perform calculations based on time periods, such as year-to-date or month-to-date comparisons, and to visualize data trends over time. In addition, they enable you to create custom date hierarchies, such as fiscal years or custom fiscal periods, that align with your organization’s reporting requirements.
Does Power BI have a calendar table?
Power BI does not have a built-in calendar table.