
20 Power BI Use Cases for Dynamics 365
“Data! Data! Data! …I can’t make bricks without clay!” | Sherlock Holmes
Even before the advent of technologies like Microsoft’s Power BI the smartest people in the world (both real and imaginary) recognized the importance of high-quality data for problem solving. These days, we have access to more information than ever before. When properly analyzed and applied, this data can answer questions, tell stories, and even help predict the future.
But what’s the best way to put this information to good use?
That’s where business intelligence software comes in. Power BI, Microsoft’s business intelligence platform, helps transform data into tangible assets that companies can use to make informed decisions and solve complex problems. Read on to learn how sales, customer service, marketing, finance and operations teams use Power BI to put their data to work.
A. Sales Analytics
Sales teams thrive when they have access to up-to-date information. Understanding the state of the sales pipeline, having an easy-to-access overview of sales performance numbers, and using past performance information to predict future sales outcomes are a few of the ways Power BI enables sales teams to succeed.
- Sales Pipeline analysis
- Sales Performance Dashboard
- Sales Forecasting
- Territory and Quota Management

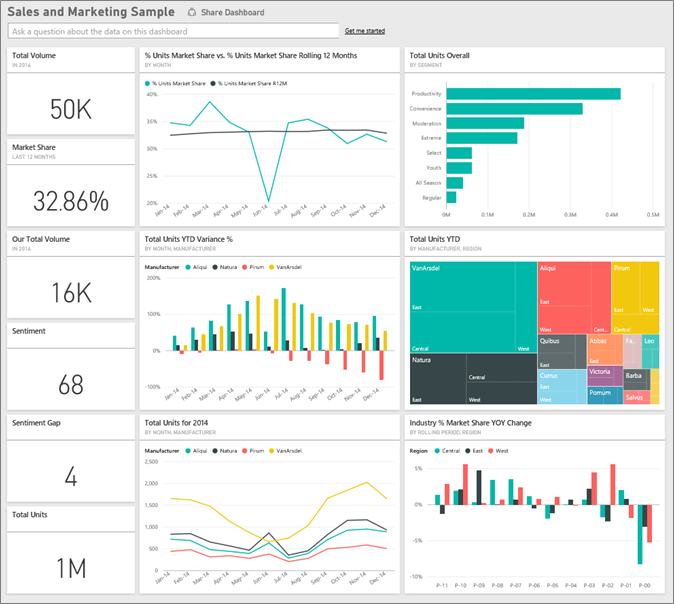
SPOTLIGHT: SALES PERFORMANCE Power BI dashboards are designed to tell stories through visualizations. The Sales Performance Dashboard brings to life the highlights of your company’s sales activities while at the same time allowing you to drill down into details like LIST OF DETAILS HERE
B. Customer Service Analytics
Providing a high level of customer service before, during and after the sale should be the priority of every business. Power BI leverages data to optimize all aspects of customer service, from measuring sentiment to managing caseloads.
- Customer Service Performance Dashboard
- Service Level Agreement (SLA) Management
- Customer Satisfaction (CSAT) analysis
- Case Volume analysis
SPOTLIGHT: CUSTOMER SERVICEPower BI’s Customer Service Performance dashboard provides information about past operational metrics and KPI’s, such as resolved cases, the number of cases a customer service agent has closed, the average time a case was open and other factors. This gives managers crucial performance information that can be understood at a glance.
C. Marketing Analytics
Marketers need to be able to measure the results of their strategy and make immediate adjustments when necessary. A Power BI marketing dashboard can measure, among other things, product volume, market share and sentiment.
- Marketing Campaign analysis
- Customer Segmentation and targeting
- Lead Generation analysis
- Social Media Analytics
SPOTLIGHT: SOCIAL MEDIA Engagement, impressions, subscribers, reach. Social media managers rely on a variety of metrics that are often generated in multiple locations across different social platforms. Pulling this information into one location saves time and aids in analyzing performance and social strategy.
D. Financial Analytics
Power BI gives financial teams both high-level and detailed views of the company’s fiscal data. This insight allows teams to accurately analyze past financial performance, make informed predictions about future performance, and make confident business decisions.
- Financial Performance Dashboard
- Cash Flow analysis
- Budgeting and Forecasting
- Accounts Receivable and Payable analysis
SPOTLIGHT: FINANCIAL PERFORMANCE Power BI’s well-regarded dashboards are especially suitable for Financial Performance. The customizable dashboard pulls up-to-the-moment information from predefined sources, creating an easy-to-read overview of metrics like revenue, profit, expenses and more. The data can also be broken down into more detailed segments (for instance, by month or by product) and visualized.
E. Operations Analytics
Supply and demand—it’s a delicate balance that manufacturers and retailers must work to achieve. With high quality data, managers can create real-time status reports that allow them to ensure supply matches demand.
- Inventory Management
- Supply Chain Management
- Production Efficiency
- Quality Control
SPOTLIGHT: SUPPLY CHAIN One hitch in the supply chain can bring a business’s operations to a complete stop. With a Supply Chain Dashboard, not only can managers predict potential problems, they can also drill down into specific data—locations, suppliers, customer segments—to help spot and prevent potential bottlenecks.
CONCLUSION
Power BI is a powerful tool for anyone who uses data in their day-to-day work; these days, that’s almost everyone. As we head full speed into the AI era, those who understand how to use their data most effectively will have a competitive advantage. So, if you’re only using Power BI to manage your operations, test it out in other departments as well. See, for example, what sorts of customer service insights you can glean using it. If you haven’t tried Power BI but are curious to see how it could work for you, request a live webinar from proMX to explore your options together.