
When and why you should switch reporting from Excel to Power BI
Content
Here we go again, you may think. proMX trashing Excel, this time to big up Power BI.
Sometimes it may appear that we dislike Excel since we often criticize its use as a project management solution. However, that’s far from the truth.
Excel is a great tool. But it’s not a panacea or a swiss army knife when you don’t have any other tool for a specific purpose.
So now we’re coming for Excel again. This time disputing its reporting capabilities.
Again, not so.
Reporting is one of the strong suits of Excel. However, Microsoft Power BI offers even more such capabilities.
So, if you are satisfied with the functionality and usability of Excel, by all means stick with it.
If, however, you feel limited in Excel and would like to get more out of your reporting, take a look at Microsoft Power BI (i.e. read this article).
The importance of Excel in business
Microsoft Excel and its benefits
To prove to you that we don’t have it in for Excel, we’ll start off by singing its praises.
Excel is a phenomenally successful tool that is used by almost every company on the planet. It is the dominant spreadsheet program on the market and there’s good reason why it is so popular.
Since it is rather intuitive to use and quite flexible, it gets used for a lot of different purposes (again, not a criticism, Excel fans).
Components of Microsoft Excel
Some of Excel’s most useful features are:
- Ad-hoc calculations
- Mathematical operations
- Data organization
- Data analysis
- Data exploration
- Graphs
- Charts
- Pivot tables
- Spreadsheet functionality
- Manual data entry
As you probably know, Excel is part of the Microsoft 365 family (previously: Office 365) and is thus only available in a package with the other tools of that suite. There is no standalone application.
The impact of Microsoft Power BI in business
Microsoft Power BI and its benefits
Let’s take a look at Power BI, which is actually very different from Excel, even though they can be used for similar purposes and some of their features overlap.
As the name suggests, Power BI is a Business Intelligence application. However, it is also a data visualization tool. In fact, this functionality is quite central. Power BI lets users create custom dashboards from a variety of different data sources.
Or as Microsoft puts it: “Power BI is a collection of software services, apps, and connectors that work together to turn your unrelated sources of data into coherent, visually immersive, and interactive insights.”
Components of Microsoft Power BI
What sets Power BI apart:
- Large data storage
- E-mail alerts to track metrics
- Quick view of KPIs in one place
- Beautiful visualizations
- Cloud-based features that facilitate collaboration
Power BI is available as a desktop application, an online service and mobile apps. Another greath thing: You can start off using it for free.
Excel vs Power BI: A comparison
Key differences between Excel and Power BI
Now that we know the basics about each tool, let’s look at how Power BI and Excel compare in terms of functionality.
1. Data sources
Power BI and Excel differ when it comes to which data sources they can work with. Excel can connect to many sources. Power BI, however, supports many more data sources.
One thing Excel has over Power BI: You can enter data manually. And while it is possible to do tabular style reports in Power BI, it’s definitely a lot easier in Excel.
And another drawback for Power BI: It cannot mix imported data from real-time connections. However, it is possible to create a report using different data sources without having to split it into several smaller reports.
2. Data visualization
Power BI definitely has the upper hand when it comes to data visualization. It offers so many different types of charts, Excel just doesn’t stand a chance.
3. Large Data
Since Excel is a client tool, you will struggle to work with files bigger than 500 MB. Power BI reaches its limit at approximately 50 million records and is much faster in processing them since it uses compression algorithms to import and cache data.
4. Collaboration & Sharing
If you’re done with your report in Excel, you can share it via e-mail or store your report on SharePoint for others to access.
It’s much easier in Power BI where dashboards can be shared via the cloud.
As you’re probably aware, collaborating with others on an Excel file is a bit of a nightmare. Before you know you have different files with varying information. In Power BI, however, its easier to share dashboards and there is only one file, so to speak.
5. Mobile devices
Ever seen a mobile view of Excel spreadsheets? Us neither.
Power BI meanwhile is mobile friendly with apps for tablets and smartphones.
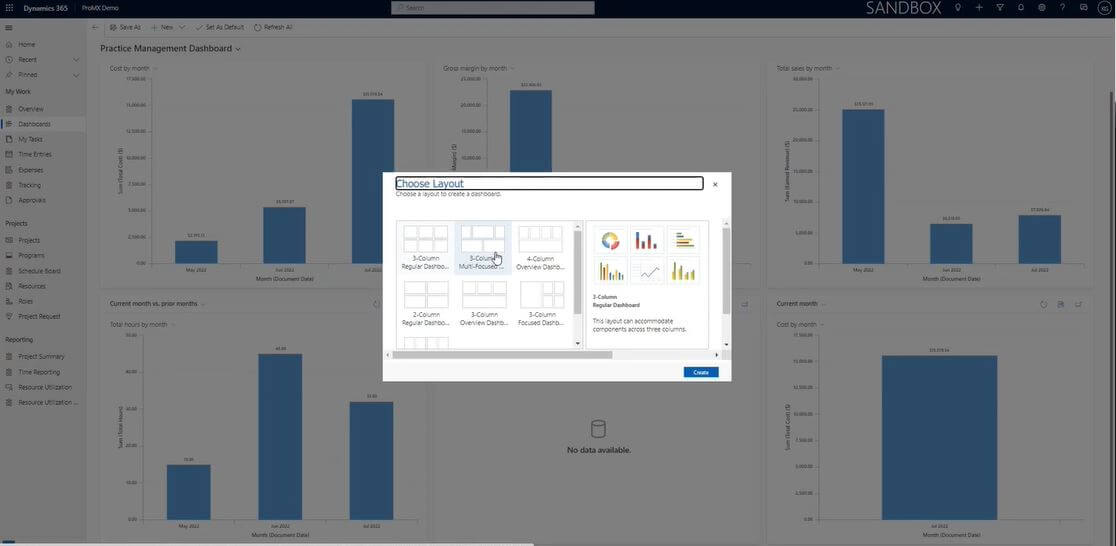
6. Dashboards
While Excel may initially seem more intuitive to use, adapting it to your needs actually requires quite a lot of effort.
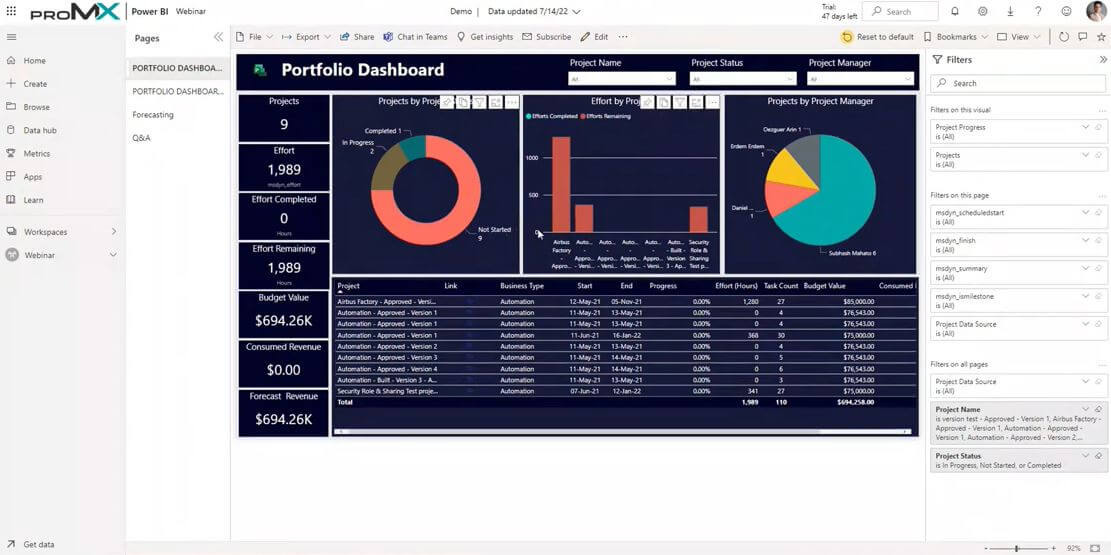
In Power BI you use drag & drop and it is easier to filter data.
Excel dashboards, on the other hand, are not very interactive compared to Power BI’s.
Conclusion: Power BI or Excel?
Power BI and Excel are siblings, not rivals, with Power BI generally offering more features but Excel also having some specific features up its sleeve.
When should you use what? It depends on your needs regarding
- Analytics
- Collaboration
- Data sources
- Size of data
- Visualizations
Most of what Power BI can do could be done in Excel, too. However, you may run into hardware problems and your graphics won’t be as nice.
In our opinion, using Excel for reporting is much the same situation as using it for project management. It makes sense up to a certain degree of complexity. So long as your processes and demands are fairly simple, by all means, stick with Excel.
Once things get more complicated and you need to professionalize, you’d be well advised to switch to Power BI.
By the way, it’s not an either or. They also work well together.
FAQ
Is Power BI better than Excel?
Power BI can be the better solution for you than Excel depending on what you want to do. If you need to create and visualize complex reports and analyses, we definitely recommend Power BI.
Can Power BI handle more data than Excel?
Yes, Power BI can handle more data than Excel and is much faster at processing it, too. It reaches its limit at approximately 50 million records.