


How to: snapshot functionality (baseline management) in Dynamics 365 Project Service Automation
Content
We have been handling many Microsoft Dynamics 365 Project Service Automation (PSA) projects for customers at proMX. I want to share some insights into common requirements we face in almost every project. While we’re at it, I will introduce you to some deeper controlling mechanics required in project controlling since they do not exist out-of-the-box in PSA right now.
There are some analytic features like Power BI solution templates but those are just samples.
Scenario: previous vs actual project plan schedule
Projects are very dynamic with a lot of different possible constellations. Delivering them on time requires deep control of the current plan and status compared to the initial value agreed with the customer.
In our scenario, we require some way to report the previous plan schedule vs the actual plan schedule. In other words, we need to see how the project schedule has changed over time.
Project managers used to just save different versions of the plan in simple tools like Microsoft Excel or they used enterprise tools like Microsoft Project that provide multiple baselines.
With Microsoft Dynamics 365 we need to find a way to save different project schedules while working with the live data, either on demand or fully automated.
Considerations
I will not go into the depths of the Dynamics 365 and Project Service Automation data model but want to highlight some basic facts about the different implementations. The source code provided is “as is” because I did not fully reimplement and test the functions for this article.
For customer implementations we provide robust and efficient implementations based on Azure functions or plug-ins. To demonstrate functionality and its implementation we try to demonstrate them with easier-to-understand Power Automate integrations and some basic SQL scripts.
Implementing a single baseline to Dynamics PSA
This first example of a possible implementation is a very basic one. The idea is to use the existing data and data model to create basic project controlling on a regular basis by saving some calculated figures as custom entity values. The custom entity is used to provide a historic reposting functionality for the data over time.
Data Model
By default in Dynamics 365 Project Service Automation the existing sales order is named Project Contract and is developed during the sales process until the customer accepts the offer and the contract is marked as “confirmed”. This confirmed state sets the Project Contract to a read-only state.
Put simply, this is our baseline! Negotiations are completed, and the customer has accepted our offer. This is the baseline we can use to report the current project status. While the project schedule may change over time during the project delivery process, the project contract will stay the same.
The project is linked to the project contract line. All related data (like the work breakdown structure (WBS) schedule and expenses estimates) imported with full detail, we get a clear picture of the “base” project schedule.
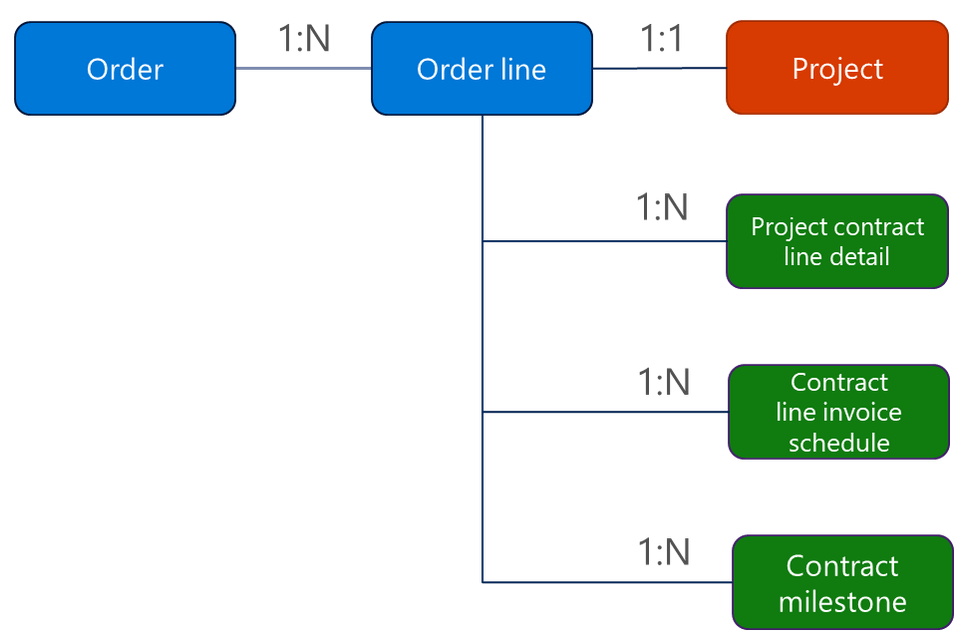
In the data model, the 1:1 relation is handled by Dynamics 365 Project Service Automation logic because it does not exist in Dynamics. In the order line, the project is provided as a look-up. When the project is set, the project estimates include the WBS schedule and expense estimates can be imported as full detail.
In our scenario, the import of estimates was automated at a fixed order line named “Order no \ Delivery”. An additional order line named “Order no” was added for further development by the salesperson during the sales process.
Here we know that when the project estimates get imported, PSA will delete all previous ones, so we would lose the salesperson’s work unless we save it in a special order line.
Project Contract as reporting snapshot
We use the project contract in its confirmed state as our reporting snapshot. There was no change in the data model because it provides every function out-of-the-box. Some automatisms and logical checks were added and the UI was updated to provide a better process flow.
Here is a small sample of what it would look like at the end:
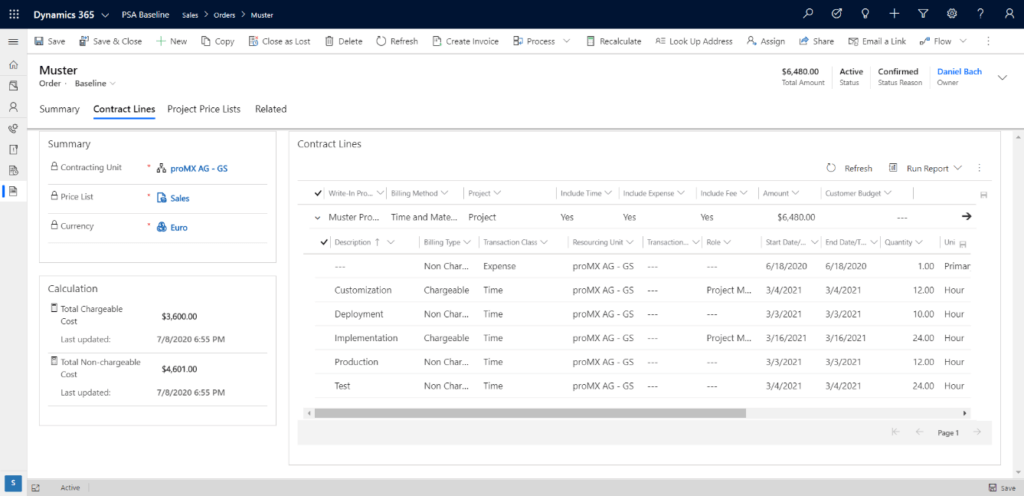
For a better overview, we restructured the UCI forms and used the editable grid with a nested view. Having all the project contract line details (I will call them ‘details’ from here on) arranged under their project contract line (‘line’ for short), gives us a clear picture of the different figures.

We use a business process flow from Opportunity to Order which will then switch over into the Project and the Project Delivery business process flow.

Our sales process includes stage gating for negotiations and dependent branches for approval processes based on the quotation volume.
Our basic project delivery process includes a close out phase to provide lessons learned and further details after project completion.
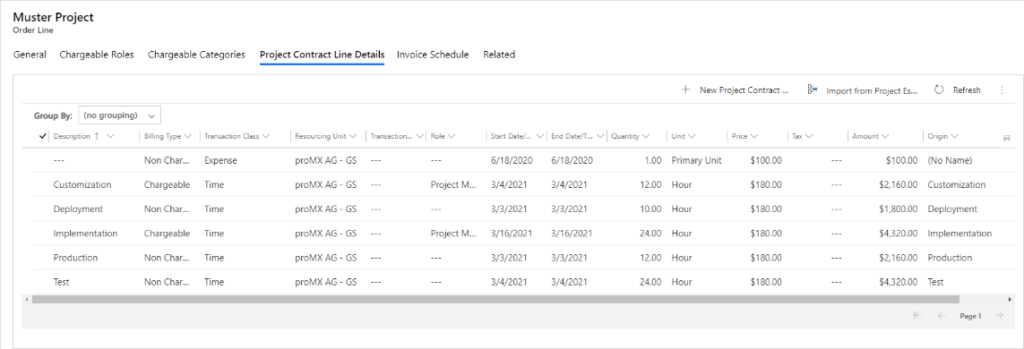
In my sample we have a very small WBS schedule with a single expense estimate:
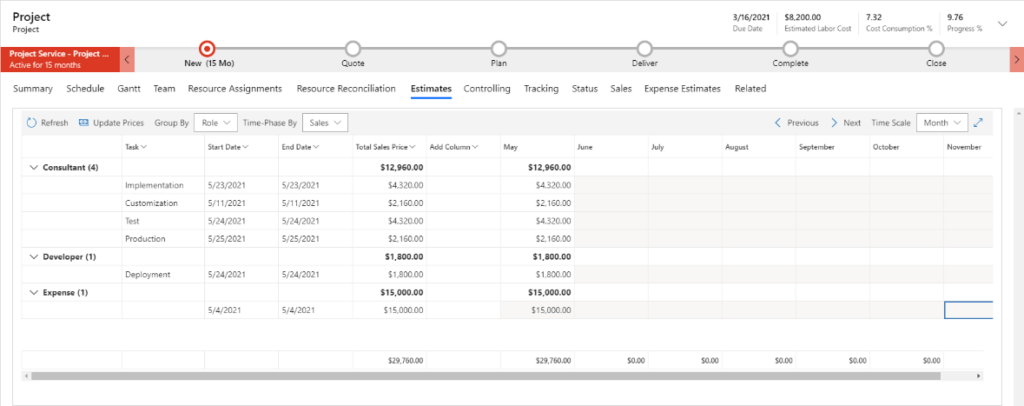
Here is the overview of the project and the estimates at the time of the import into the project contract:
Financial Detail: report
To provide reporting of project schedule changes compared to the snapshot, we implemented a custom entity to store our values. Once created (automated every month for every project and on trigger), this entity collects and saves all data from the project contract and project delivery at the given time.
Financial Detail:
| Name | Type | Description |
|---|---|---|
| Budget | Float | Values from Project Contract |
| Forecast | Float | Values from the Project |
| Actual | Float | Values from the Actuals |
| PoC | Float | Percentage of Completion |
| Project | Lookup | Related project |
| Project Contract | Lookup | Related Project Contract |
| Project Contract Line | Lookup | Related Project Contract Line |
| Unit | Lookup | Difference time and expense |
| Transaction Class | Option | Difference time and expense |
| Transaction Type | Option | Difference sales and cost values |
| Date | Date Only | Reporting Date |
| Report | Lookup | Related Report |
To provide easy monthly reporting and to avoid having to deal with mass data over time, we also added a reporting entity where all financial detail records are grouped by the date. For better a overview, we added Excel templates providing Pivot reports based on the data.
We also added a process flow to provide a review and approval process for monthly project review meetings.
Report:
| Name | Type | Description |
|---|---|---|
| Date | Date Only | Reporting Date |
| Project | Lookup | Related Project |
| Description | Textbox |
Logic behind the implementation
The core logic was implemented with a robust Azure function and ribbon button triggers and a time schedule. To show the basic idea of the logic behind this implementation, I added a very basic Flow to illustrate how it would work.
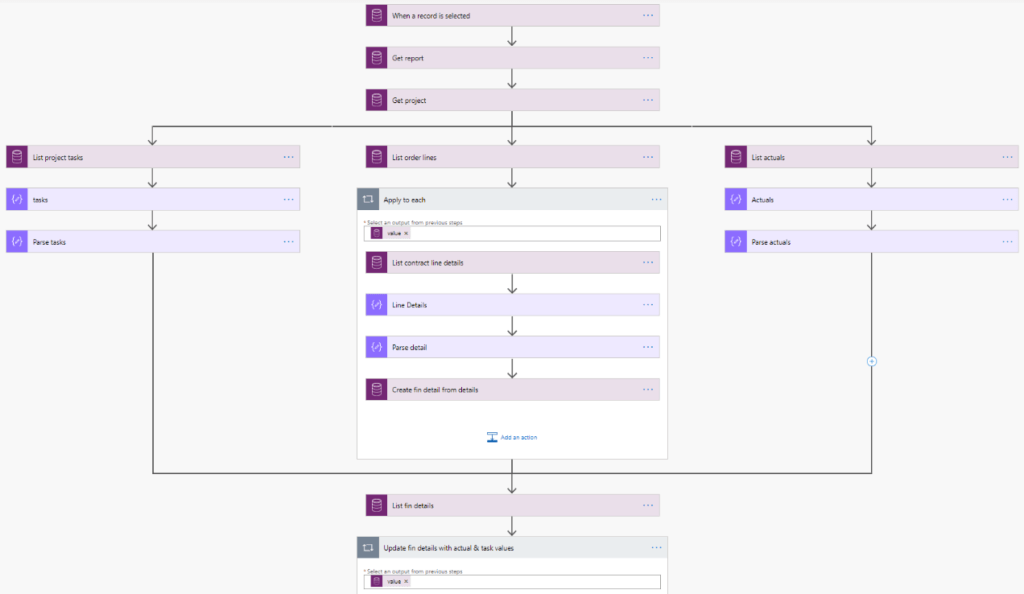
- When the process is triggered (whether automated or by user interaction), we grab the details of our report entity and its project affiliation.
- With the project in mind, we select every related project task representing our ‘Forecast’ figures and the estimate lines.
- All project-related actuals are selected representing our ‘Actual’ figures.
- We select the related project contract by querying the project-related order line. Now it depends on the customer scenario whether only the linked order line with its line details should be considered or every detail in the contract.
- At the very end, all data needs to be merged to create a single financial detail line in our report entity.
The handling in this article was based on the default Dynamics 365 Project Service Automation entities without deep customizations. In our customer scenario, we had to use transaction categories with an additional mapping table to match against the tons of SAP categories. Grouped by the responsible contracting unit, we had clean figures and no issue in merging the values.
When using the default system, consider a ‘group by’ definition because there is no WBS ID existing on the project contract side, and name match won’t work in every situation.
Controlling: ordered values vs actual project data
At the end of each month during project delivery, a new report with the current financial details is triggered by a Flow. The Flow collects the data from the project contract, project WBS and project expense estimates and adds the project-related actuals to it.
In the report itself, the data is provided in a grid view to give an overview of the ordered values vs the current project plan and actual data tracked in the system.
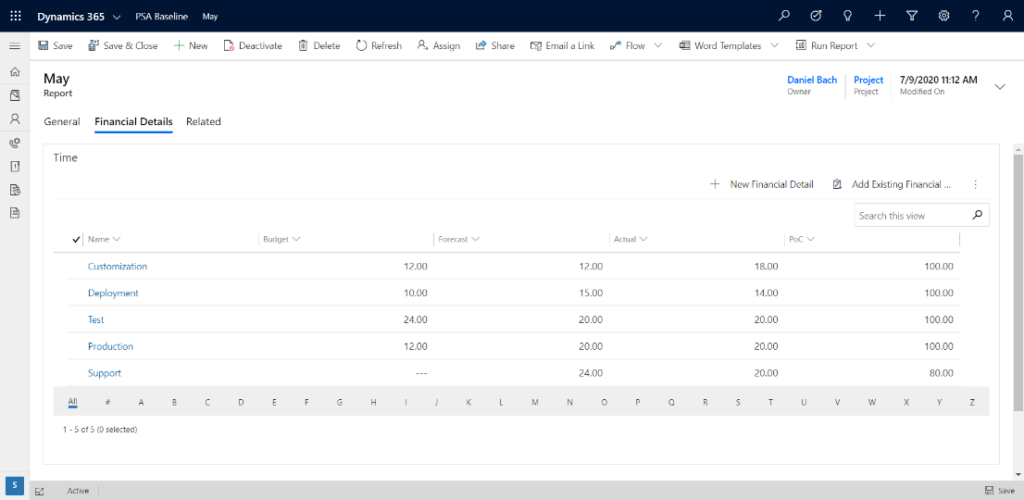
In the sample report we can see some differences in the figures. Some project estimates are different, and we also see a brand-new project task which was not part of the original project contract.
Since nobody enjoys validating columns and rows, we added an Excel template to report the data with Power Pivot. With no need of implementing Power BI or other reporting services it is easy to add calculations and other validations to an Excel file. The data is saved within the report entity and will not change over time.
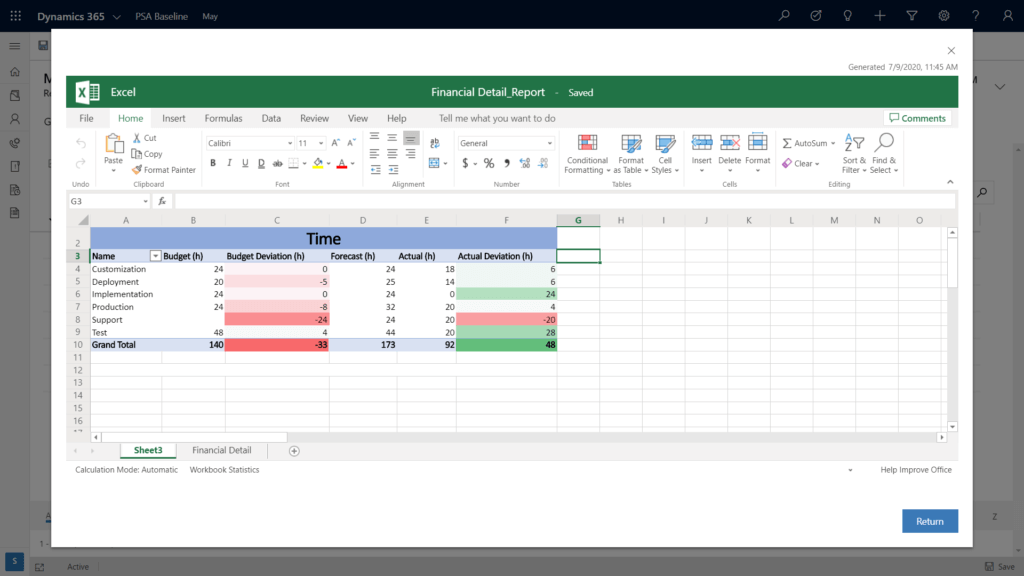
Well, here I need to confess that the report from our customer was much better than mine. Having worked with Power BI and SQL servers for years now, my Excel skills have withered. ?
Recap
This implementation was very easy but it does provide deep reporting based on different figures. In the customer project, the actual data was provided by an internal SAP system where sales only works with Dynamics 365. The project manager wanted an easy way to compare the contracted values and have a long-term reporting method to see changes in the project schedule.
With data as custom entities, we controlled the flow and added functions to automate report generation but also added them for users to create as many reports as they desire. Since flows are added to the UI, users can directly access and use them to trigger data generation.
For the so-called monthly progress meetings between the different project managers, different KPI measures were also added to give deeper performance controls, like a risk matrix and handling for different milestones.
FAQ:
Yes. The Microsoft Dynamics 365 business app encompasses several solutions for every business need. Dynamics 365 Project Operations was specifically developed for project management purposes. It combines functionalities for project planning, resource allocation, project control, time tracking and more in one application.
Dynamics 365 Project Operations is a Professional Service Automation (PSA) app for project-centric service businesses. It unifies capabilities for all aspects of the project lifecycle in one software. They include but are not limited to: sales, project management, resource allocation and business intelligence.


RECENT POST
OUR EVENTS

