
Stop reacting, start preventing: How Azure Application Insights helps you detect and resolve issues
Content
Highlights
- Move from reactive troubleshooting to proactive monitoring by using Azure Application Insights to detect issues before they affect users.
- Monitor availability, performance, and exceptions through telemetry, dashboards, alerts, and advanced analytics.
- Identify root causes faster with exception tracking, user session analysis, custom telemetry, and Power BI integration.
- Leverage AI-powered insights such as Smart Detection and AI agents to uncover anomalies and accelerate investigations.
- Set up Application Insights with minimal effort and follow proven monitoring best practices to improve system reliability and performance.
Have you or your team members ever faced the situation where your system suddenly stops working or slows down? In many cases, teams decide to invest more resources in their applications. By then, troubleshooting can become time-consuming, costly, and frustrating.
A better approach is to use a monitoring system that collects and analyzes telemetry, so teams can detect performance issues, errors, and unusual behavior before they affect users.
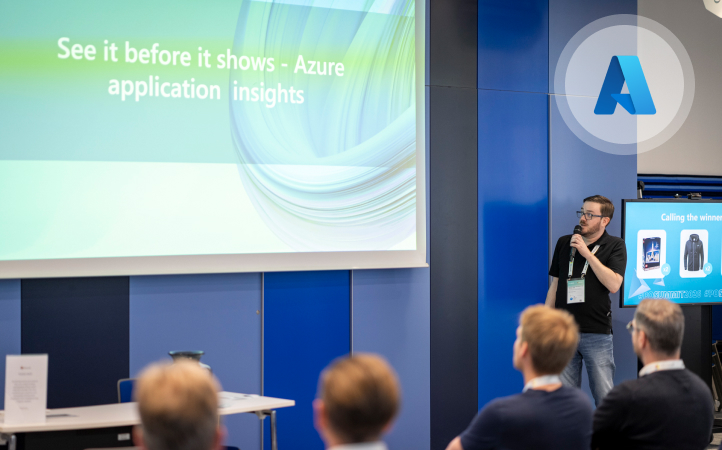
In this article, inspired by Daniel Bach’s proMX Project Operations + AI Summit 2026 session, we will walk you through the Azure Application Insights feature, how to set it up, and how you can turn raw signals into actionable insights.
What is Azure Application Insights?
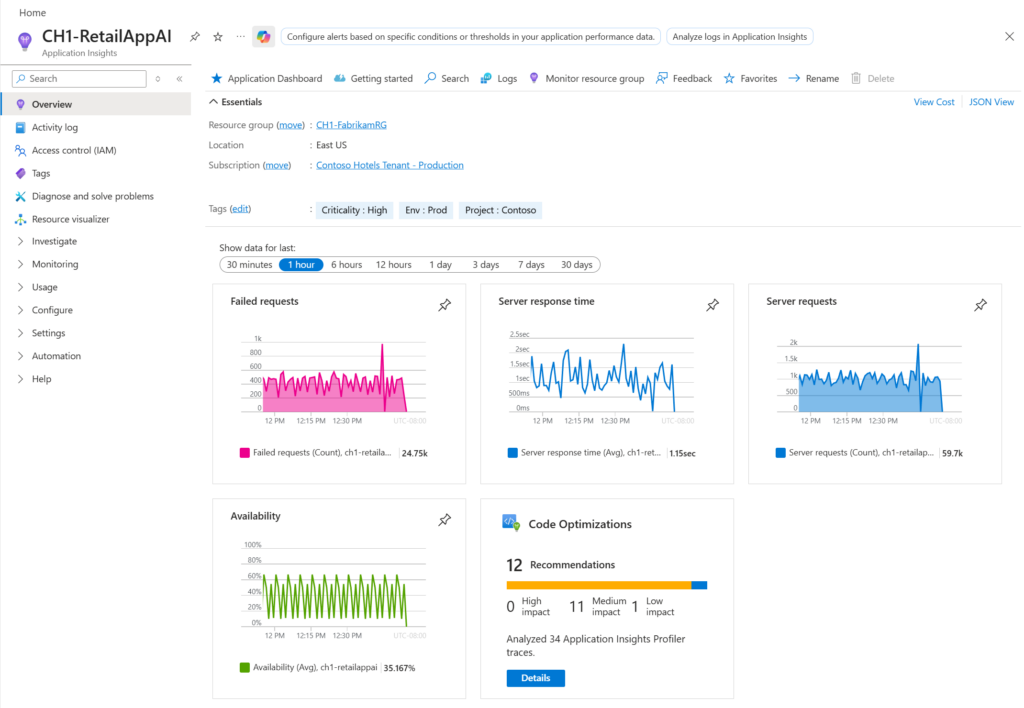
Screenshot of the overview pane inside Azure Application Insights (Source: Learn Microsoft)
Azure Application Insights is a feature of Azure Monitor used for Application Performance Monitoring (APM), allowing admins and developers to conduct live monitoring, logging, and performance analysis. This solution, which acts as a data repository, helps you keep track of the health of your apps and optimize them by analyzing telemetry data across platforms.
As a result, admins and developers can proactively identify and resolve issues. Now, let’s have a look at the key features of Azure Application Insights and how they make proactive troubleshooting possible.
How Azure Application Insights gets you from reactive to proactive troubleshooting
Monitor availability and service health
Unlike reactive troubleshooting, with Application Insights teams can identify early warning signs, such as outages and availability issues, before tickets are even generated:
- Ping tests and availability monitoring verify whether applications and endpoints are accessible.
- More advanced tests can use Azure Functions to validate authentication and business-critical processes.
- SLA and uptime reporting help organizations track service availability over time and identify recurring problems.
- Alerting and Smart Detection can automatically notify administrators when availability drops or unusual behavior is detected.
Identify performance issues early on
Next time someone asks you how your applications are performing, you won’t need to guess. Azure Application Insights helps you monitor system performance:
- Performance monitoring tracks response times and long-running operations.
- Analysis of P95 and P99 percentiles helps identify the slowest user experiences that averages often hide.
- Cohort and trend analysis makes it possible to compare performance across regions, user groups, or time periods and detect regressions before they become widespread issues.
- Built-in dashboards and visualizations provide an at-a-glance overview of system health and performance trends.
Investigate errors and understand their root cause
Behind every incident, there is always a root cause. The challenge is to identify it accurately and promptly before it disrupts business operations. Here are some useful features from Application Insights:
- Exception tracking offers a timeline view of errors, including occurrence frequency and affected endpoints.
- User session and activity tracking helps reconstruct what happened before an issue occurred by showing navigation paths, requests, and user interactions.
- Custom telemetry and dimensions can enrich standard monitoring data with information from plug-ins, Power Automate flows, scripts, or PCF controls.
- Log Analytics enables advanced root-cause analysis through KQL queries.
Turn insights into action
Collecting data is only the first step. Data only becomes a powerful asset once you know how to use it effectively. Thanks to Application Insights, teams can act on it:
- Predefined queries and workbooks provide ready-made analysis for common scenarios such as slow plug-ins or recurring exceptions.
- Azure DevOps integration allows teams to create work items directly from Application Insights findings.
- Dashboards, reports, and Power BI integration help share insights across support, development, and operations teams.
- Automated alerts ensure that critical issues are addressed before they affect a large number of users.
Use AI to detect and investigate issues faster
When troubleshooting performance issues, even a few minutes can make a difference. Azure Application Insights uses AI capabilities to help teams detect unusual behavior, investigate issues faster, and reduce the need for manual analysis:
- Detect anomalies automatically through Smart Detection, which highlights unusual spikes in exceptions, performance degradations, and other potential issues.
- Use AI agents to investigate exceptions, analyze user sessions, and interactively query telemetry data.
- Accelerate root-cause analysis with AI-assisted reviews and summaries that make complex telemetry data easier to understand and act on.
How to set up Azure Application Insights
Luckily, setting up Azure Application Insights is a straightforward process that requires minimal configuration. Once connected, telemetry data is collected automatically, providing visibility into system performance, user activity, and exceptions.
Here is a step-by-step list that guarantees a successful implementation:
1. Create a Log Analytics workspace in Azure
Before you start your Application Insights journey, you need to create a dedicated Log Analytics workspace. This helps maintain a clear naming convention and improves long-term management of monitoring resources.
2. Create an Application Insights resource
Next, create a workspace-based Application Insights resource and link it to the Log Analytics workspace you created in the previous step. By doing this, you can store and analyze the telemetry collected from your Dataverse environment.
3. Choose the telemetry to collect
Now you can choose the data that is most relevant to your monitoring goals, such as diagnostics, performance metrics, and plug-in activity, page views, or Power Automate executions. Choosing just the most important data helps you focus on what really matters and control storage costs. Keep in mind that different logging types, such as Dataverse and Power Automate flows, currently require separate Log Analytics workspaces and cannot be configured in a single workspace.
4. Start monitoring and analyzing
Once configured, telemetry is sent automatically to Application Insights. There you can find built-in dashboards, alerts, workbooks, and KQL queries.
Congratulations! You can now start monitoring performance, investigating exceptions, and identifying trends before users report the issues.
In his session, our Senior Solution Architect, Daniel Bach, presents a live demo of how to set up Azure Application Insights and analyze the performance, exceptions, and user activity within business applications, specifically focusing on environments like Dynamics CRM.
Watch the full recording below:
Best practices for proactive monitoring with Azure Application Insights
Before wrapping up, we have listed some best practices extracted from Daniel’s session.
- Create Log Analytics first: Start by setting up your Log Analytics workspace before creating Application Insights. This helps you define a clear naming structure from the beginning and makes your monitoring resources easier to manage later.
- Adjust retention time as needed: Keep telemetry data only for as long as you need it for troubleshooting, reporting, and compliance. This helps control storage costs while still giving teams enough historical data to analyze recurring issues.
- For GDPR concerns, remove user GUIDs: If you need to meet privacy or compliance requirements, avoid storing personal identifiers such as user GUIDs. This helps reduce the risk of exposing sensitive user data in monitoring logs.
- Enrich with custom logging: Add custom telemetry from plug-ins, scripts, Power Automate flows, or PCF controls to capture business-specific information that standard monitoring may not include.
- Split in different Log Analytics Workspaces: By splitting them, it is easier to track down the running costs.
- Focus on P95/P99: Instead of relying on average response times, monitor the P95 and P99 percentiles to identify the issues that affect users the most.
- Focus on long-running operations: Pay close attention to operations that take longer than expected, such as slow plug-ins, workflows, or API calls. These are often the first indicators of performance bottlenecks.
Conclusion: Replace guesswork with evidence
Performance monitoring should begin before users complain, not when the issues affect business operations. Here’s when Azure Application Insights comes in: it opens a brand-new opportunity for teams to conduct proactive troubleshooting effectively and without much effort. Teams can easily get visibility into availability, exceptions, performance, and identify root causes instead of relying on guesswork.
If you’re a solution architect, admin, or maker who wants to move from reactive troubleshooting to proactive monitoring, get in touch with our team of experts.
FAQ
What is Azure Application Insights?
Azure Application Insights is an Azure Monitor feature that collects and analyzes telemetry data, helping teams monitor application performance, availability, and errors.
How can I configure Application Insights in Azure?
Create a Log Analytics workspace, set up an Application Insights resource, connect your environment, choose the telemetry you want to collect, and start monitoring through built-in dashboards and analytics tools.
How can AI help analyze Application Insights data?
AI helps detect anomalies, identify performance issues, generate insights from telemetry data, and support root-cause analysis through tools such as Smart Detection and AI agents.



RECENT POST
OUR EVENTS