Microsoft Power BI: Your gateway to a data-based company culture
Content
A business that does not generate data? Unheard of. Businesses that have data but nobody to prepare them and that make decisions more based on intuition than facts? You can guess the answer. Do you know the solution, though? It is called Microsoft Power BI.
Power BI is a tool not merely for analysts or controllers. Due to its ease of use, it enables virtually everybody in a business to create reports, understand data or make it understandable for others with the help of visualizations. Thanks to the many data sources Power BI can be connected to and its numerous visuals, it enables data-based decision making in all areas of a business. Microsoft calls this “closing the gap between data and decision making”.
However, first one needs to understand what Microsoft Power BI is, how it works and what one can do with it.
What is Microsoft Power BI?
Power BI is the name for a series of applications, services and connectors that help organizations to visualize data from various sources. Even business intelligence novices can work quickly and easily with the tool. Subsequently, they can share the results with other people in their organization or embed them elsewhere.
It can be used as a desktop, browser and mobile application.
It is one of four components of the Microsoft Power Platform, which enables non-developers to build business applications and chatbots, automate tasks and prepare data.
Main components of Power BI
Power BI is comprised of several connected components which can be used separately or in combination, depending on need and the user’s role in the company.
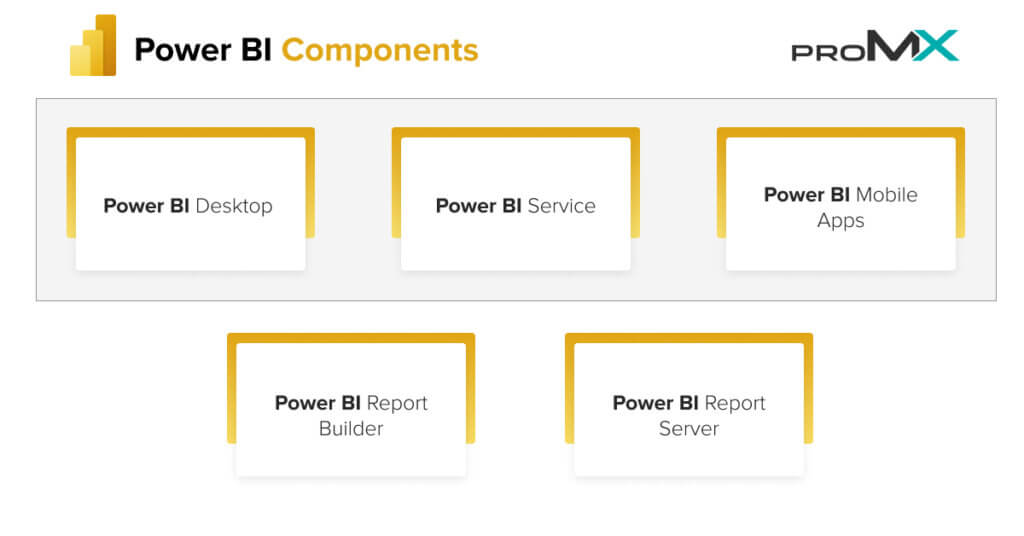
- Power BI Desktop
Power BI Desktop is a free desktop application. It is used connections to your data. The number of possible sources is nearly unlimited. Following that you can transform your data (bringing it into the right format) with dynamic queries, filter and visualize it. This forms the basis for your reports.
The desktop version of Power BI is required to create reports.
- Power BI Service
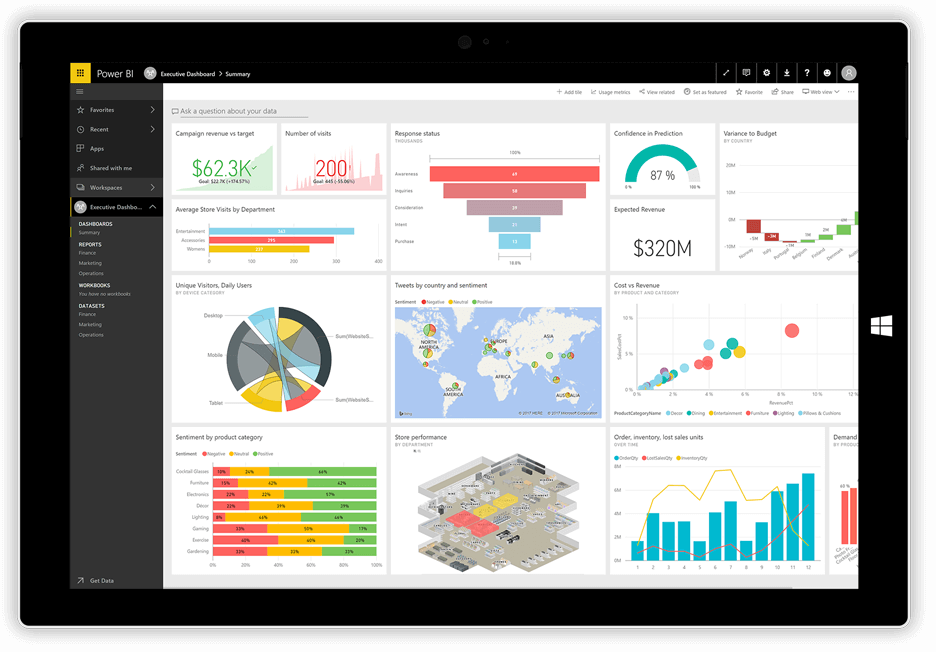
The Power BI Service is a software as a service (SaaS) application, meaning you use it in your browser. It is often referred to as Power BI Online. Here, you can create dashboards made up of different tiles, bundling information and visuals on one page.
This service enables you to share reports with other people in your organization. They cannot access them on your local Power BI Desktop app, after all.
You can also create data connections and models with Power BI Service. However, this functionality is more limited than in the desktop app.
Power BI Desktop and Power BI Service share several features, including reports, visuals and data filters. Each also has specific functionality, including data transformation and structuring in the desktop app and dashboards and paginated reports in the service.
- Mobile Power BI Apps
The mobile Power BI apps allow you to view dashboards and reports on mobile Windows, iOS and Android devices from any place at any time.
| Power BI Desktop | Power BI Service | Mobile Power BI Apps | |
| Use | Locally | Online | Mobile |
| Purpose | Connect data Create data models Create reports Visualize data | Create dashboards Share reports | View dashboards |
| Users | managers data analysts business intelligence experts | Team members Potentially a wider audience (e.g. when embedded on a website) | Mobile users |
Besides these three basic components of Power BI, there are two additional optional elements:
- Power BI Report Builder
The Power BI Report Builder is used to create paginated reports and share them in Power BI Online.
- Power BI Report Server
If you require an on-premises solution, Power BI Desktop can be used to create reports on the local Power BI Report Server. This way the data is stored behind your company’s firewall rather than in the cloud.
Power BI benefits
In the long run, using a business intelligence tool will accelerate analysis of big data and result in minimized risk and increased profit. It enables organizations to track developments in real-time rather than having to view nosediving graphs after the fact, wondering why nothing was done about it sooner. This is why business intelligence tools are so useful.
Power BI also has these particular benefits:
- Easy connection and preparation of data
- Intuitive use even for beginners
- Analysis on any device from any place
- Warnings when data has changed
- Quick implementation, no IT know how required
- Can be integrated with other systems
- Inexpensive start into Business Intelligence
Data sources
You can use data from more than 200 different sources in Power BI, including:
- Local data
- Data bases
- Power Platform
- Azure
- Online services (OneDrive, SharePoint etc.)
- Other sources
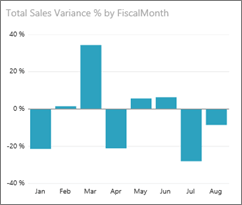
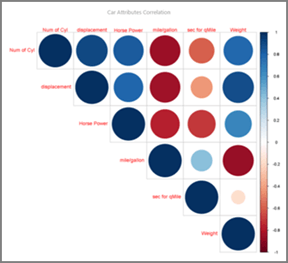
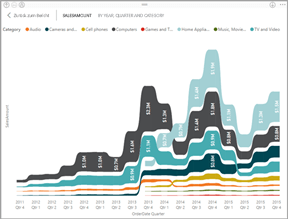
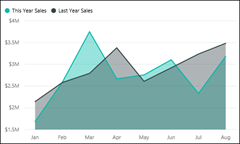
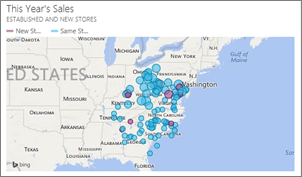
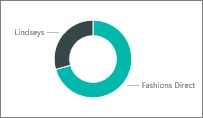
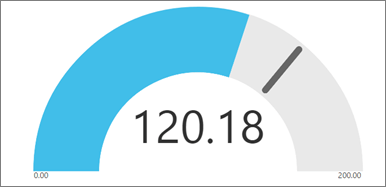
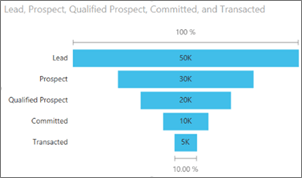
Visualizations
If you are not a number cruncher, you may have difficulty making the right decisions based on bare figures alone. You need some context to understand data, recognize peculiarities and explain correlations to others. In this case Power BI is exactly the right tool for you. It is not just pie and column charts. Other visualizations include:
Working with Power BI
Power BI is not just a tool for analysts and numbers people, a fact supported by its ability to use voice queries. There are many use cases in various business areas:
Sales people can use the mobile app to keep track of leads and the sales pipeline while on the road. HR can compare the monthly sickness levels. Accounting can stay on top of all overdue invoices. And management can use dashboards to view details of various areas at any time.
In the beginning, it may be helpful to create existing templates. Microsoft’s many free tutorials will surely turn you into a Power BI expert soon.
Would you like to try Power BI for free? Get your demo version from proMX today!
FAQ:
No, Power BI is not included in Microsoft 365. The application is part of the Microsoft Power Platform.
Power BI is a tool to visualize data and create reports to make data more understandable for everyone, not just analysts and controllers. It enables non-developers to build business applications and chatbots, automate tasks and prepare data.