

Project Operations: Advanced reporting with Power BI
In Project Operations, we have several ways to control the progress of our project, for example the tracking tab providing an overview of Effort, Effort remaining, Effort completed and some other values. These figures come in a table view, which is not state-of-the-art.
In this article, we will have a deeper look at existing report extensions we can implement into Dynamics 365 and our projects to gain more direct insights at a glance.
Overview: Project for the Web & Project Operations
Project for the Web
With the launch of Project for the Web, Microsoft moved all data to the Dataverse for storage. Users can access all the data in the Dataverse as well as in a so-called default environment within the Project app.
The installed solutions in the system are called “Project” and divided into:
- Project Service Core
- Project Service Anchor
This makes it possible to extend the Project data with customizations made in the Dataverse.
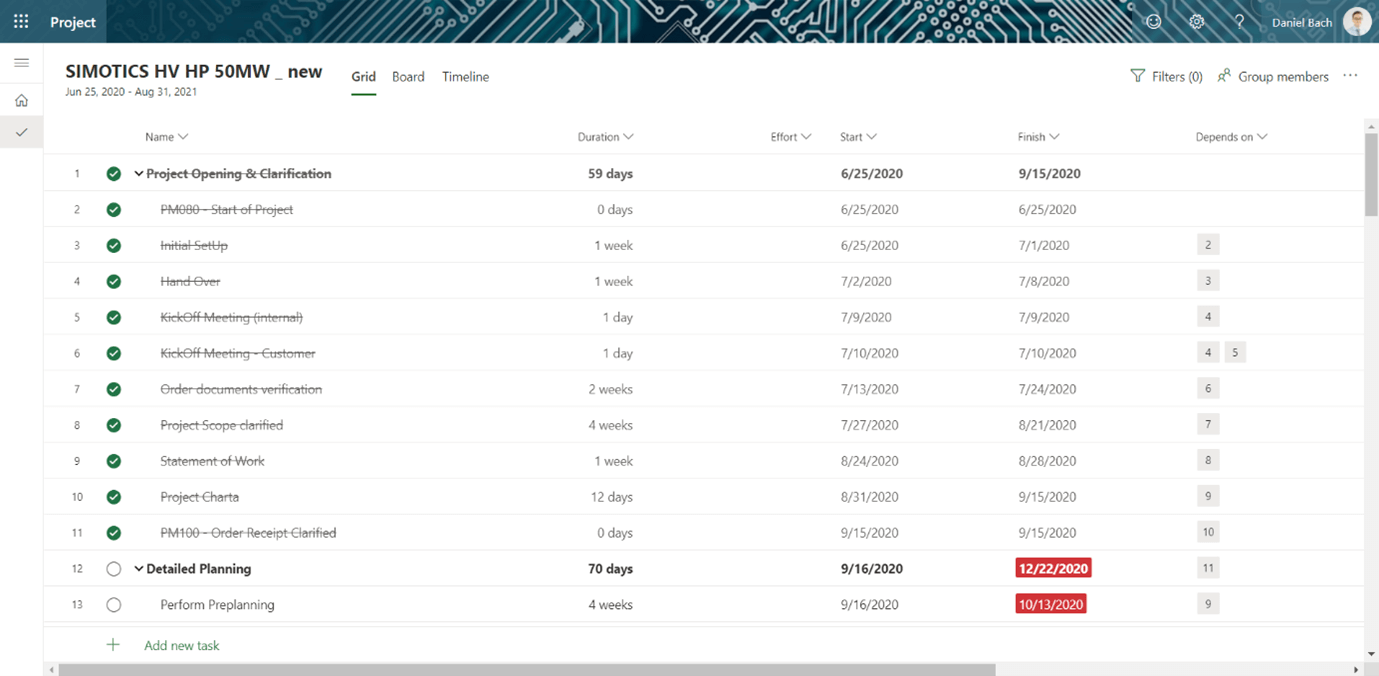
Figure 1 Project for the Web
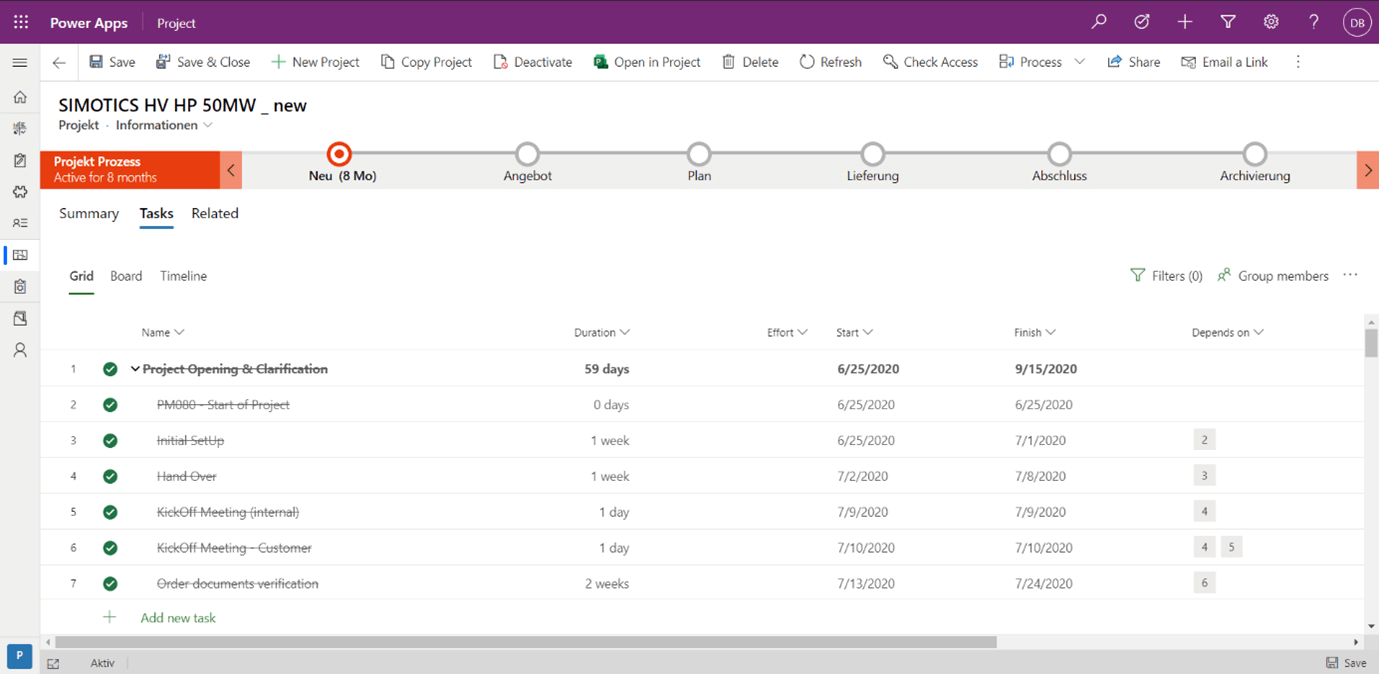
Figure 2 Power Platform – Project app
Project Operations
Dynamics 365 Project Operations (PO) is Microsoft’s latest project management app that replaces Dynamics 365 Project Service Automation (PSA). PO’s engine is based on Project for the Web.
Project Operations stores its data in the Dataverse, whereas displays such as the Kanban Board or Grid View are based on P4W. This is visible by adding the Project Service Core solution to PO, an extension to support sales processes or project controlling.
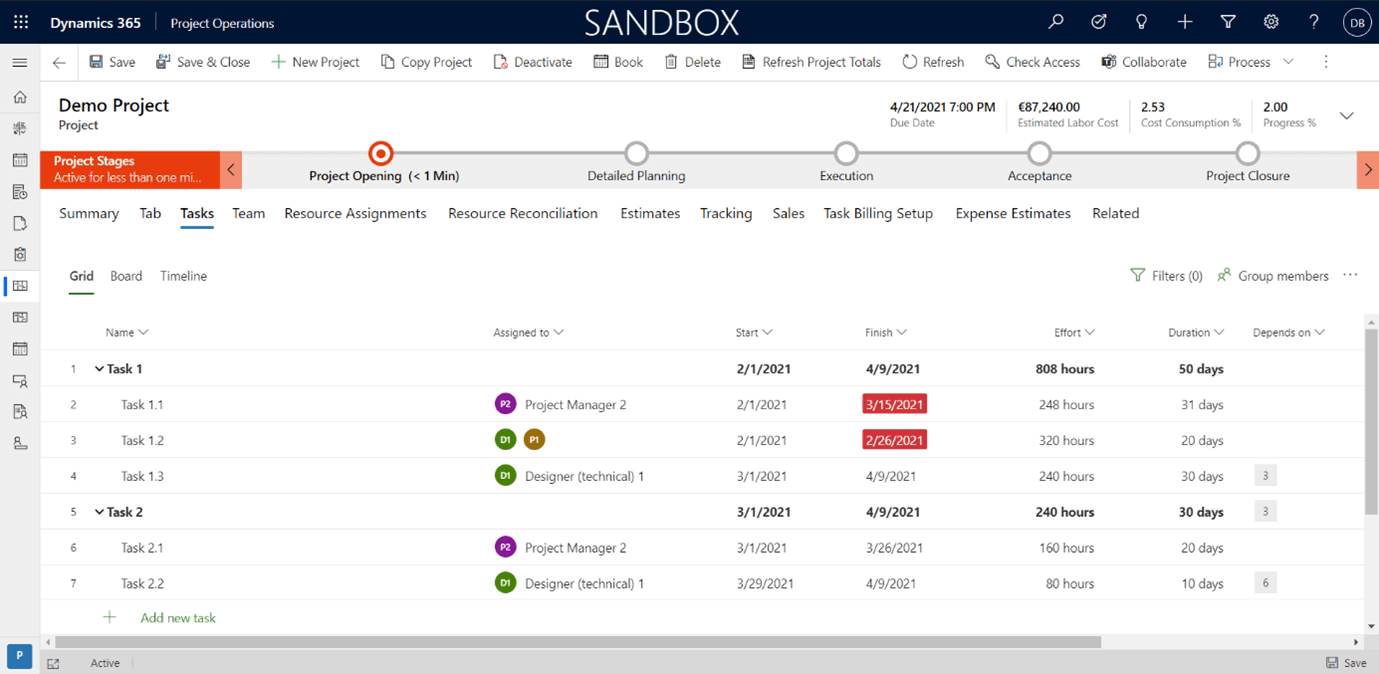
Figure 3 Project Operations
When we look at the Project for the Web project list, we will also find Project Operations projects there marked with the product icon. Once the user opens this project, they will be redirected to the Project Operations app on the Microsoft Power Platform.
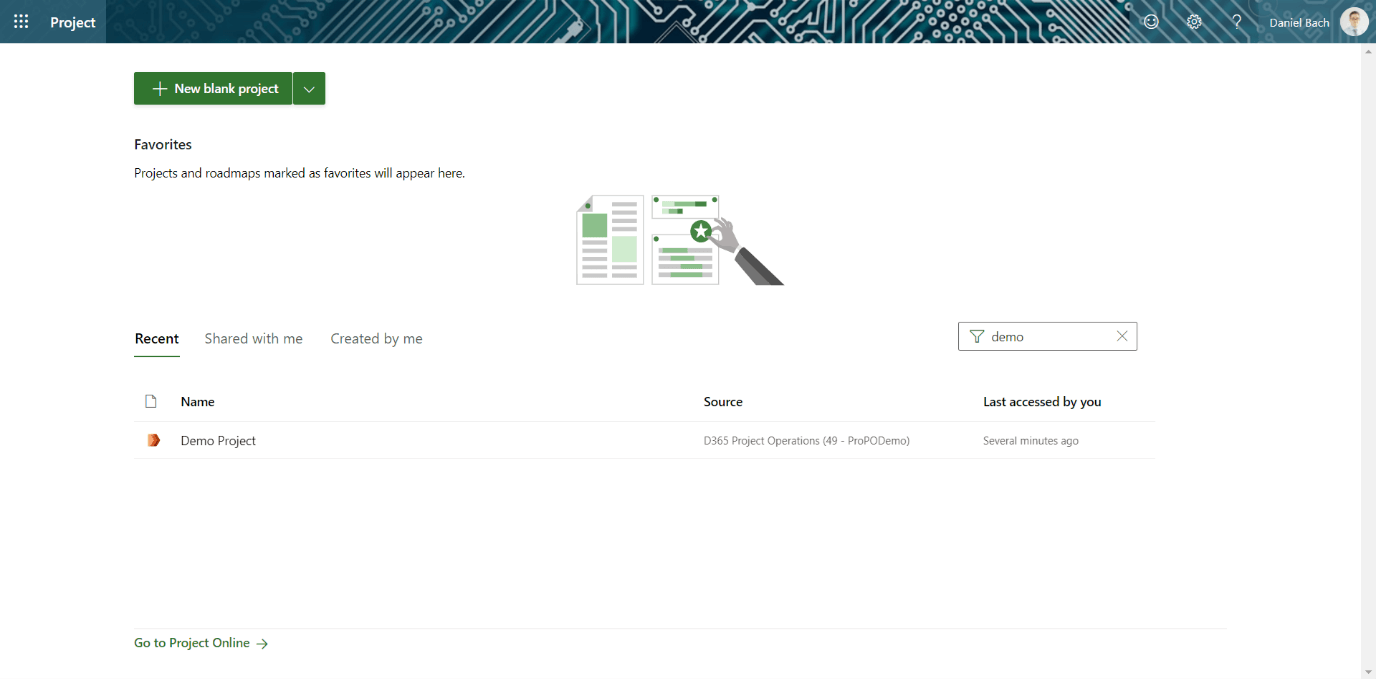
Figure 4 Project for the Web displaying Project Operations projects
How to: Advanced reporting with Power BI
There are plenty of templates for Power BI reports out there, either directly available from AppSource or ready-to-use templates provided by Microsoft themselves. These templates are a good starting point for what this article will cover: connecting our Power BI report to a Project Operations environment.
Microsoft Dynamics 365 Project Operations and Project for the Web (P4W) share the same core data model based on the Project Service core solution. As Power BI connects to any Dataverse, we can simply replace the P4W environment URL (based on the default Dataverse environment) with any Project Operations environment URL (based on Sandbox or production Dataverse environments).
Project for the Web Power BI Template
The P4W template provided at GitHub was designed to use the data from the Dataverse. There are additional templates to support project reporting for P4W as well.
In our scenario, we want to connect the report to a Project Operations environment.
- After downloading the template file, you will be asked to enter the system URL. Simply enter it where Project Operations is installed. The report will start loading the data and we can save the report to publish it to our Power BI service and start sharing it.
- In the Report and the “transform data” you will quickly discover an error. It comes from Project Operations not using the Roadmap Feature existing in P4W. You can simply ignore these errors while the related report pages are hidden in the template or delete these roadmap queries.
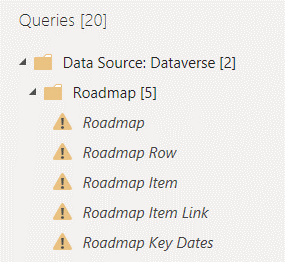
Figure 5 Roadmap does not exist in Project Operations
- After deleting the roadmap report pages, we will save and publish our report and enable the scheduled refresh to keep your data up-to-date. We could stop at this point, but let us keep going instead, because we want to add our report to the Project Operations system so every user with a Power BI License can use it there directly.
Share P4W Report
Before we can add the report to our environment, we need to enable the scheduled refresh.
- For this, we open the Power BI Service and navigate to the workspace where we published our report. At the left Navigation or in the workspace overview, we will find our uploaded report and its dataset. There we will find the schedule refresh settings.

Figure 6 Enable scheduled refresh for our dataset
- In the dataset settings, we will see that we need to authenticate our connection and save it in the Power BI Service so the data can be loaded. There we can also check or update the report parameter which we set at the beginning. So, it is possible to change the system for the report on the fly. To enable the refresh, we click on “edit credentials” and simply select the “oAuth 2” and sign in.
We just saved our connection data in the service, which will be used to load our data into the report. - As a final step we enable the scheduled refresh to update on a daily basis.
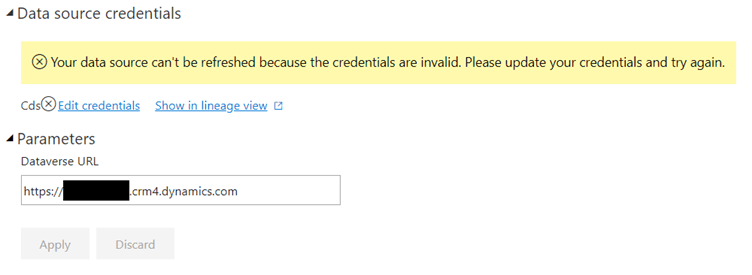
Figure 7 Set connection credentials
Add P4W Report to Dynamics
Our report is ready to use and the data will be refreshed every day so we can add the report in Dynamics we need to create a Dashboard first. The easiest way is to open the report and “pin” the full report page as a live dashboard.
Live means all data slicers and report interactivity stay as they are.
- To do this, open any report page and at the top navigation “pin to dashboard”. We will be prompted to give our new dashboard a name and save it.
- Navigate to Project Operations app in Dynamics and open the dashboards overview. At the top, we can select New → Power BI Dashboard and a wizard will open where we can select our dashboard.
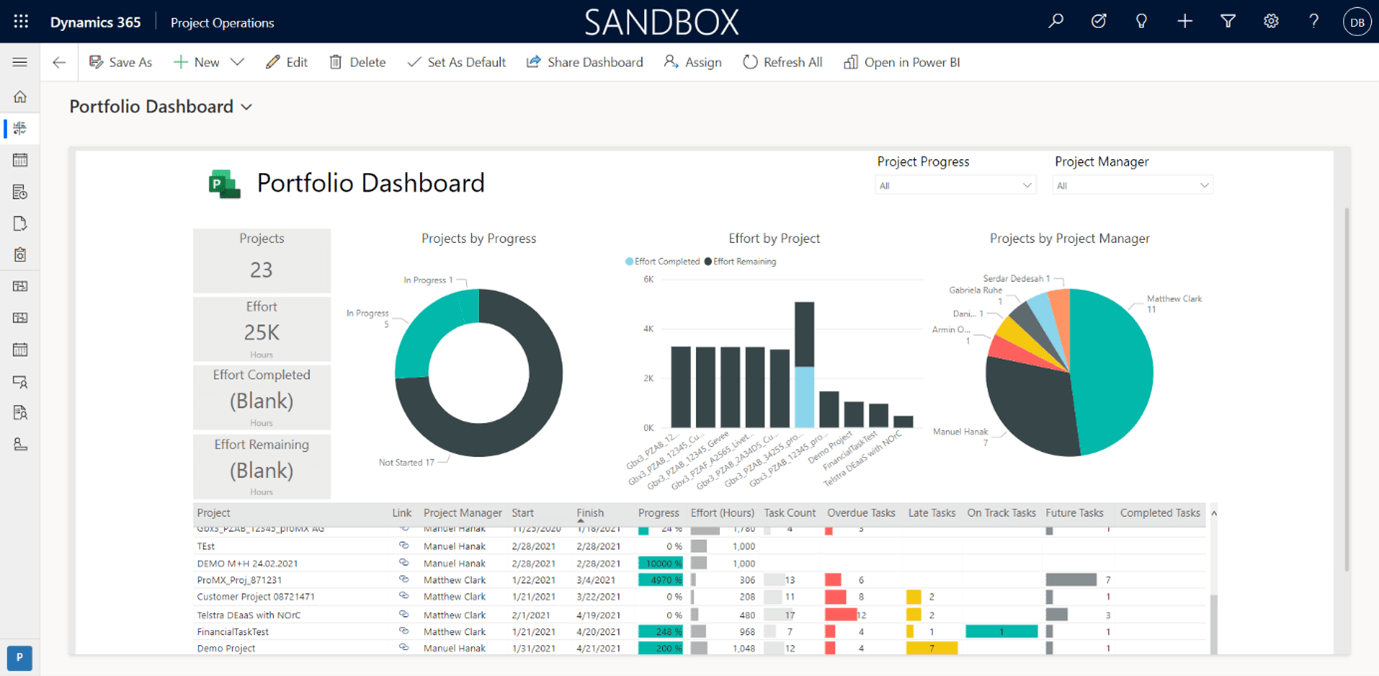
Figure 8 P4W report added to Project Operations as dashboard
Embed Report in Dynamics Forms
Just now we used the P4W report template together with our Project Operations data and added dashboards to our system. A small gap in the dashboard is the missing filtered data, meaning every time we open our dashboard, we need to select the project or resources we want to look at.
With Power BI and Dynamics, it is possible to enable filters based on the data record we are in and show only its related Data. This is the embed a Power BI report to a model driven form. For this, we need to make a small customization in our P4W Report and add a report page to the Project Operations project form.
- First, we need to identify the report-related IDs so we can add it to our project form. To do this, we open the related report page in the Power BI online service we want to add. In our sample we use the “resource assignments” report. At the top of the report page, we will find Share → Embed Report → Website or portal.
- We then need to copy the address to get our GroupID, ReportID and the TitleURL. As explained in the Microsoft Article, the TitleURL is everything until the first “&” and the GroupID and ReportID we also see in the full address.
Full Address: https://app.powerbi.com/reportEmbed?reportId=32313b5f-4c2c-4649-a889-6143418cd585&groupId=ef65e0b1-746c-42ec-bef7-xyz&autoAuth=true&ctid=1234-xyz&config=xyz
ReportID: 32313b5f-4c2c-4649-a889-6143418cd585
GroupID: ef65e0b1-746c-42ec-bef7-xyz
- Now we have the key data of our report and need to create a filter condition. For this we need to identify filter criteria like the project ID in our report, we can Find in Table “Projects” named “Project ID”. The equivalent in Dataverse would be table “msdyn_project” and column “msdyn_projectid”
If we want to build a contextual filter, it should look like this:

The filter needs to be added as a single line. As we can see it is in JSON Format.
- Now we have our control which we can add to any Project Operations project form. To add it, we create a new customization solution and add the project entity to it, along with the form we want to customize. Now it is a little bit easier when we add a new tab to this form and name it “resource assignments BI.” Once this step is completed, we need to export the unmanaged solution to add our report.
- After the export, we can unzip the solution file and open the customizations.xml with an editor of our choice and search for our tab name. There we need to add our “control” section in the <row><cell> under the </labels>.
- Once we added the changes, we can re-zip the 3 files and import them to the system. When the import is complete, we need to publish the changes made and we can verify the project form to see the added report in the resource assignment BI tab.
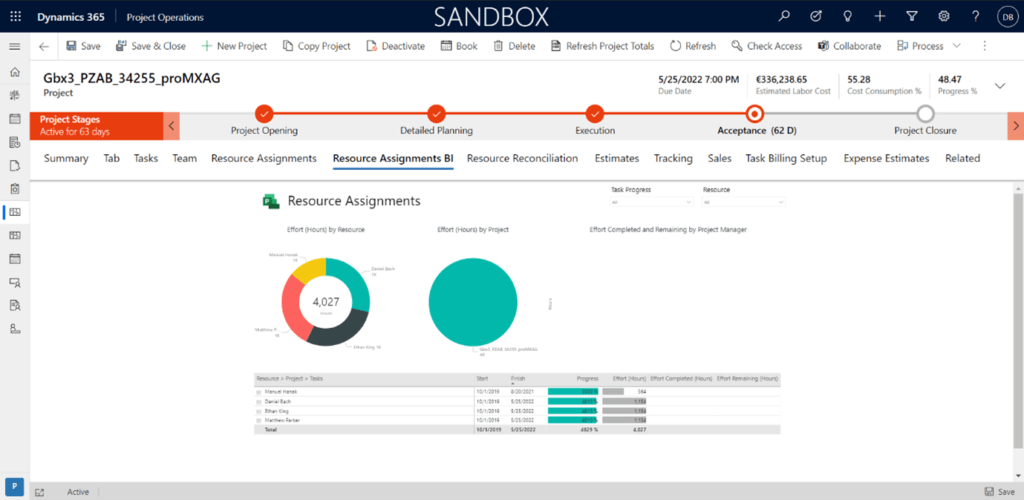
Figure 9 Resource assignment report added to the Project form
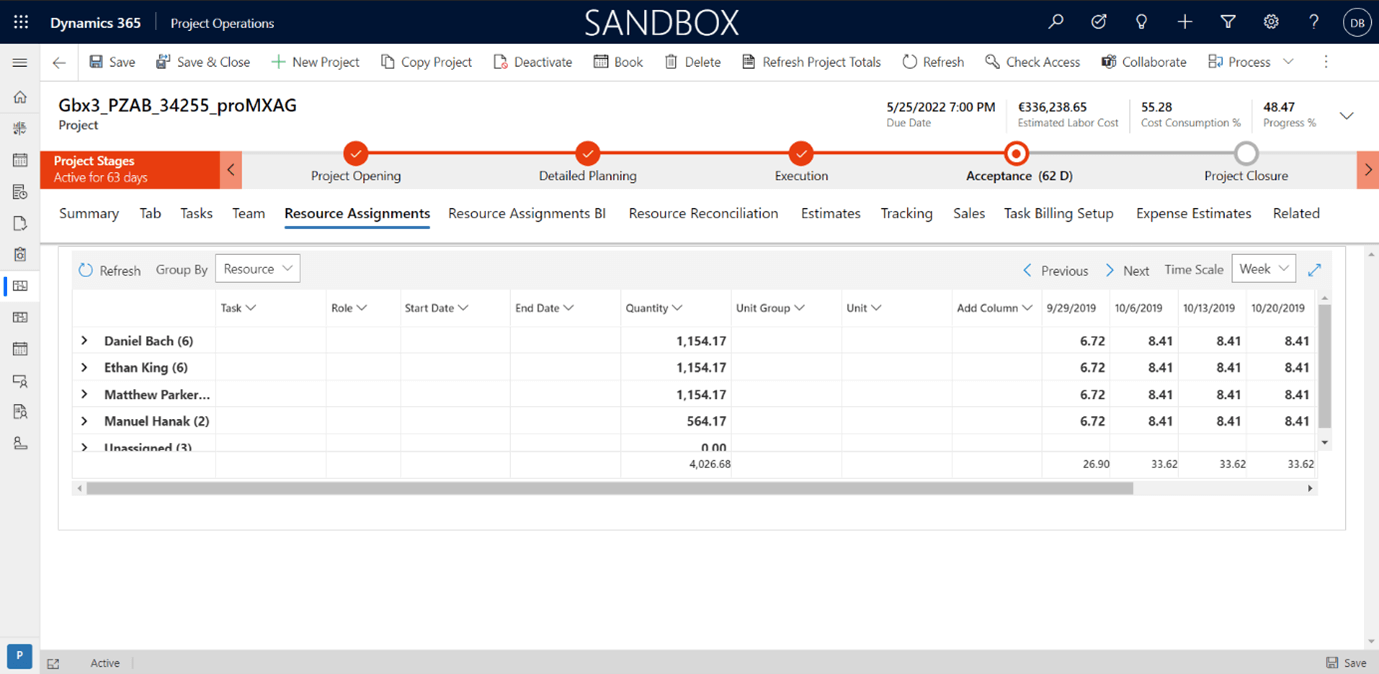
Figure 10 Compared view with Project Operations resource assignments tab
We successfully added the P4W Power BI Template to the Project Operations environment by using P4W’s data, and created an overall dashboard with comprehensive insights into the project data.
To reduce the work of filtering out project and granting direct access, we added the report to the project form by using contextual filters.
Project Managers can now access their projects and immediately see the project-related data filtered out in the report.
This implementation can easily be done the same way for Project for the Web by using the default environment with some customization effort.